
Disclaimer: The findings of the following article should not be taken as investment advice as it is the sole opinion of the writer
Bitcoin’s rise from $10,000 to $11,000 was slow, but steady. However, of late, the market’s bulls seem to have run out of steam. The outlook for Bitcoin on the medium to long-term timeframe seemed bleak, at the time of writing, and the following article explains why.
Bitcoin 4-hour chart
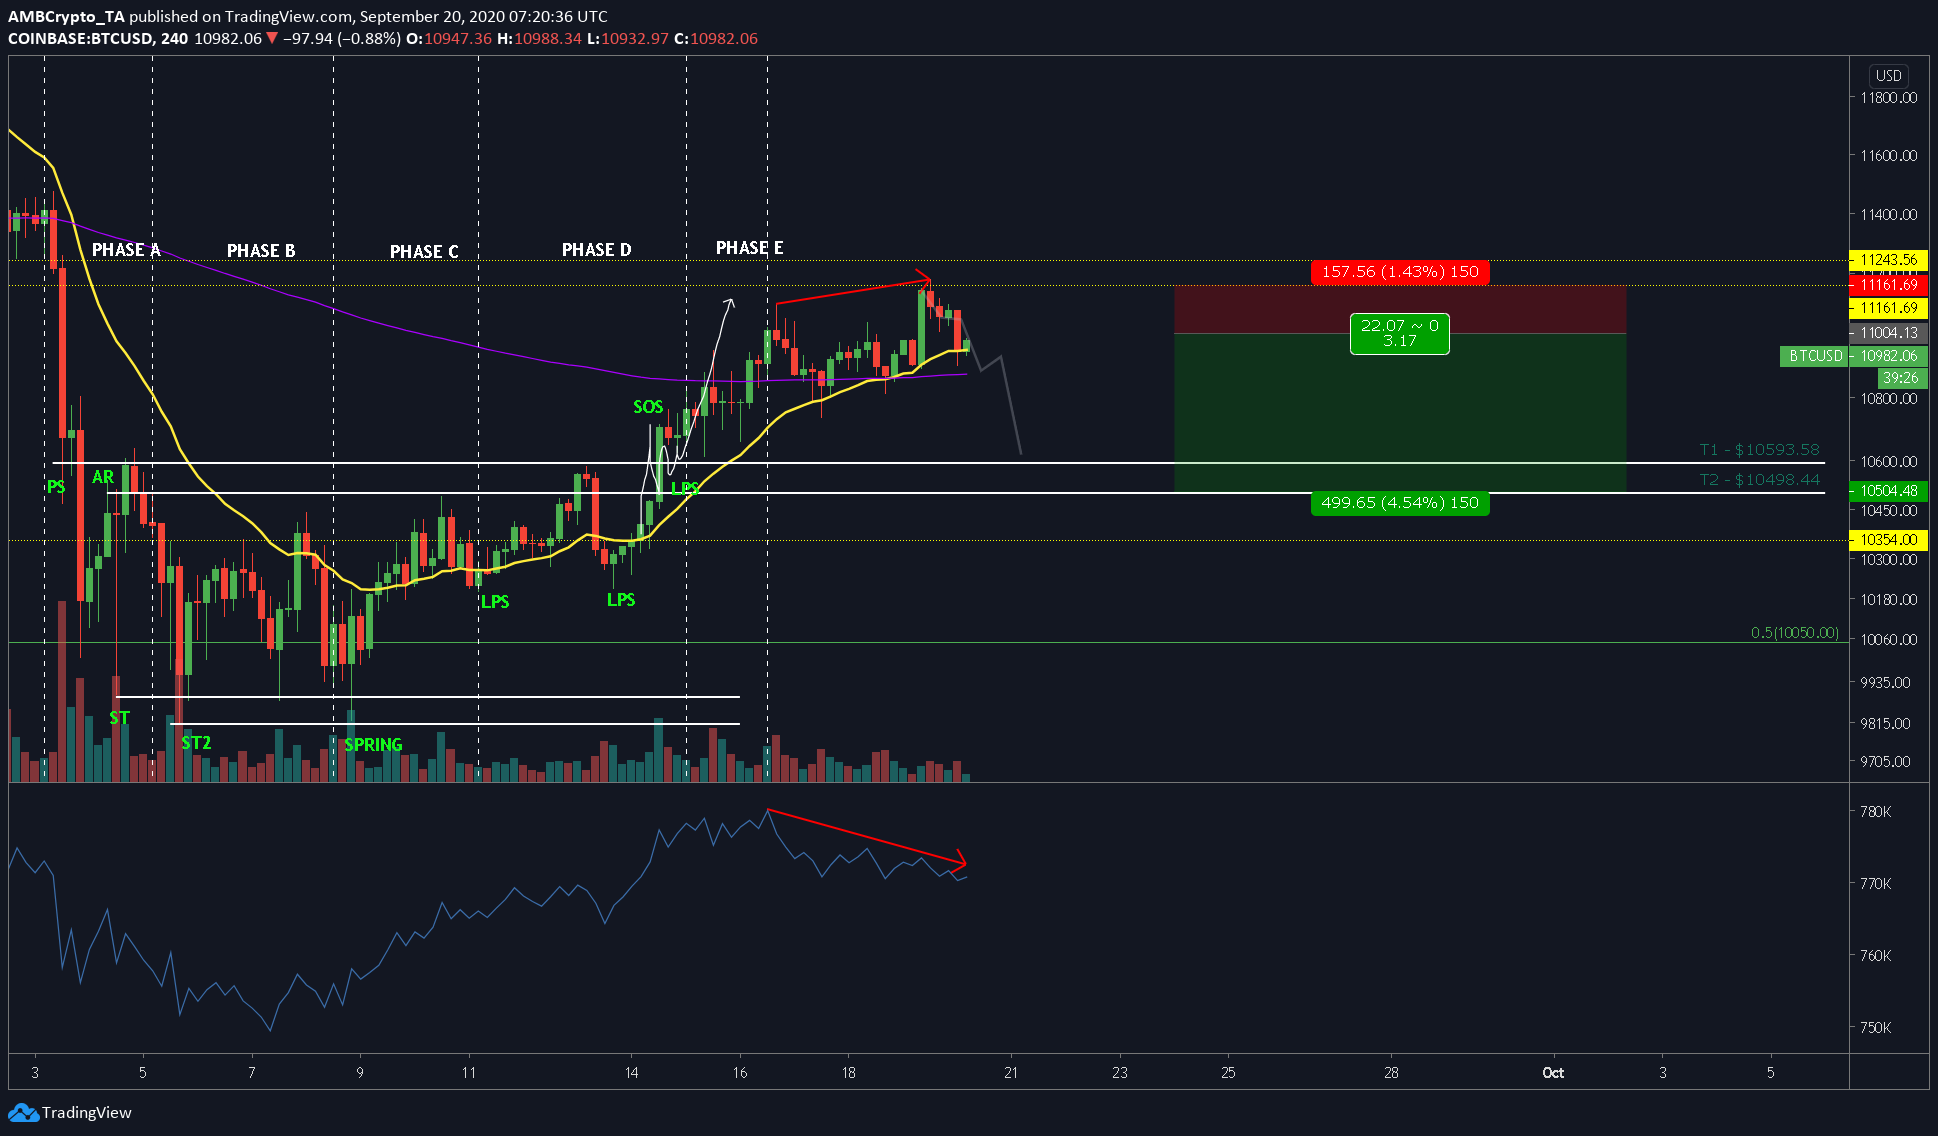
Source: BTCUSD on TradingView
Although the price of Bitcoin is barely, yet desperately clinging to $11,000, it will soon loosen its grip. What follows next will be a descent down to $10,000 and there are a few reasons why this will happen.
The first reason is the end of the Wyckoff Accumulation phase. As mentioned in a previous article, Bitcoin perfectly followed the Wyckoff accumulation phases and reached its short-term target – which was $11,000. Since this level poses a strong resistance, a surge beyond this seems less likely. The proof of this lies from late-June to early-September.
Hence, the natural path for Bitcoin would be to head South.
The second and a technical reason backing the incoming downtrend is the bearish divergence between the price and the OBV indicator. The same is obviously bearish, especially since the price has risen without proper volume backing it.
Similarly, the surge from 19 September was buyers’ fumes pushing the price higher with no volume backing it. This has created a bearish divergence that will push the price lower down the charts. In fact, it had already started 24 hours ago, with the price dipping by 2.21% since then.
The only reason behind BTC’s price sustaining itself thus far is due to the support of the 200 EMA, along with the 20 EMA on the 4-hour time frame.
Additionally, the 1-day time frame formed a bearish crossover, high into the oversold zone, an observation that is also an indication of an impending downtrend.
Hence, opening a short position with an entry of $11,004.13 and a stop-loss at 1.43% would yield an R of 3.17, if the target is $10,498 and 2.61 with the target at $10,593.


