Bitcoin

Bitcoin exhibited recurring patterns over 2019, similar to the ones seen in nature
Posted:
| Last updated: February 13th, 2024

The leaves that bud out of the stem, the pattern on the shell of snails, the petals of flowers; all of these have a common denominator, a pattern. Nature follows a particular kind of symmetry. The world that we live in has many mysteries to it, many that might seem chaotic to naked eyes. However, there seems to be a pattern emerging out of this seemingly chaotic world and the only way to look at this pattern would be to zoom out and look at the bigger picture.
Mystified by it, the Greeks and the Romans used the pattern in all of their structures. The repetition of these patterns is called fractals. Every decision we take might seem arbitrary, but we are collectively influenced by a higher power; not that of a higher being, but of nature.
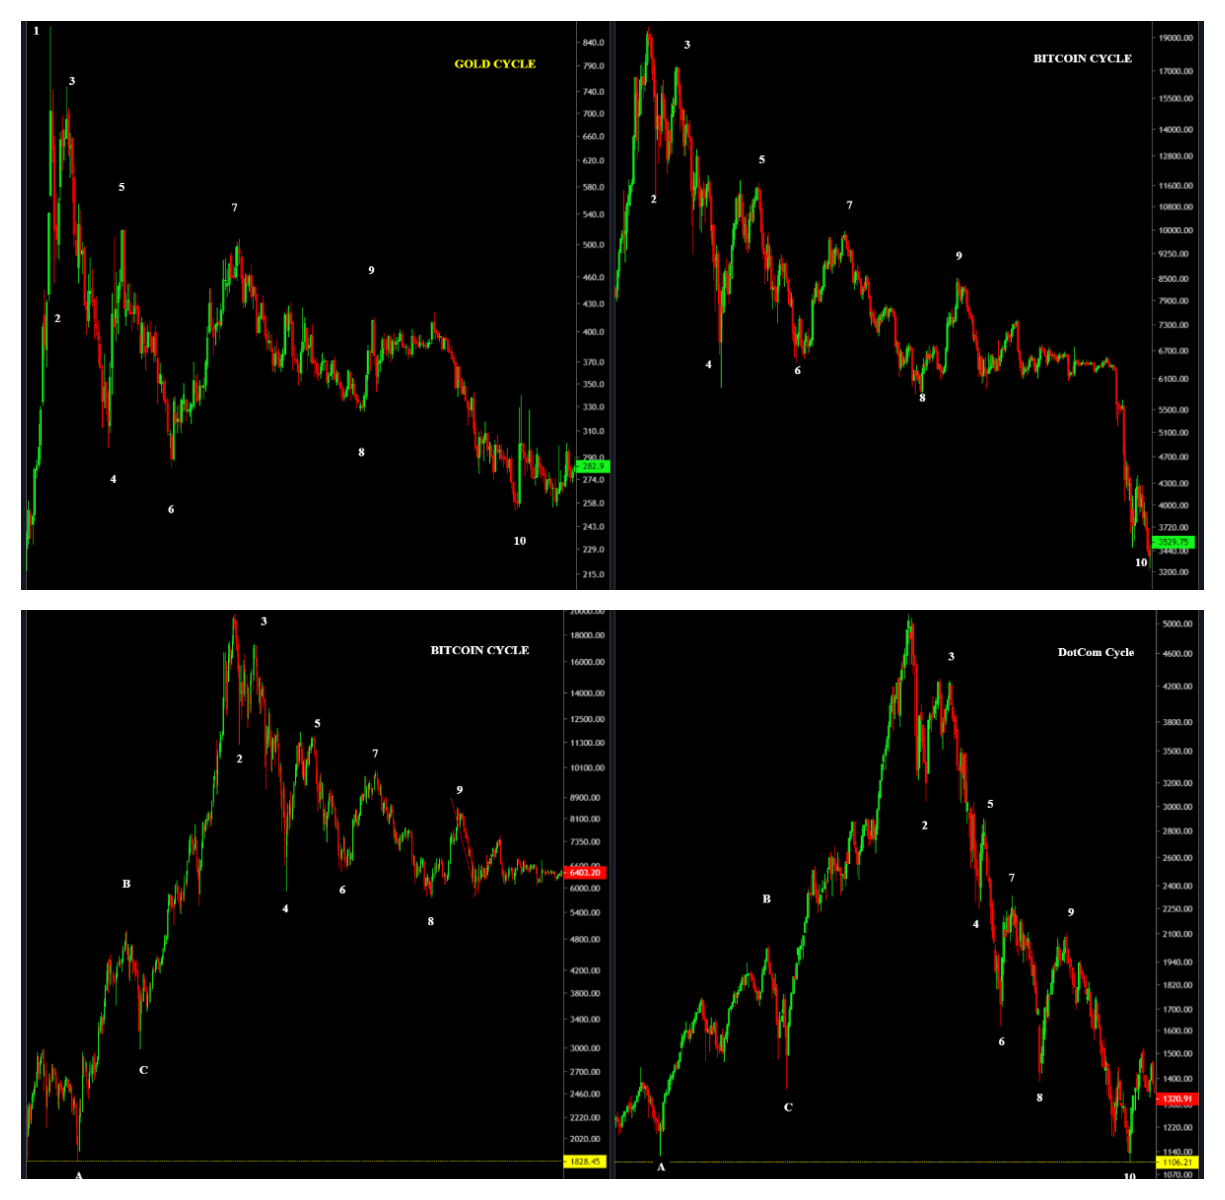
Source: BTC/USD on TradingView
Perhaps, the most apparent example is the stock market. Although people in stock markets are out to make profits, a pattern can be seen in the price charts; an inescapable pattern, be it Bitcoin, S&P500, DotCom bubble, gold rush, etc.
A pattern in a pattern
Despite our conscious efforts to stray away from the path, on a larger time scale, human behavior seems to converge, forming a repeating pattern. Over the course of 2019, Bitcoin has repeated itself, forming a fractal. To people who caught it, they had an opportunity to seize a good profit.
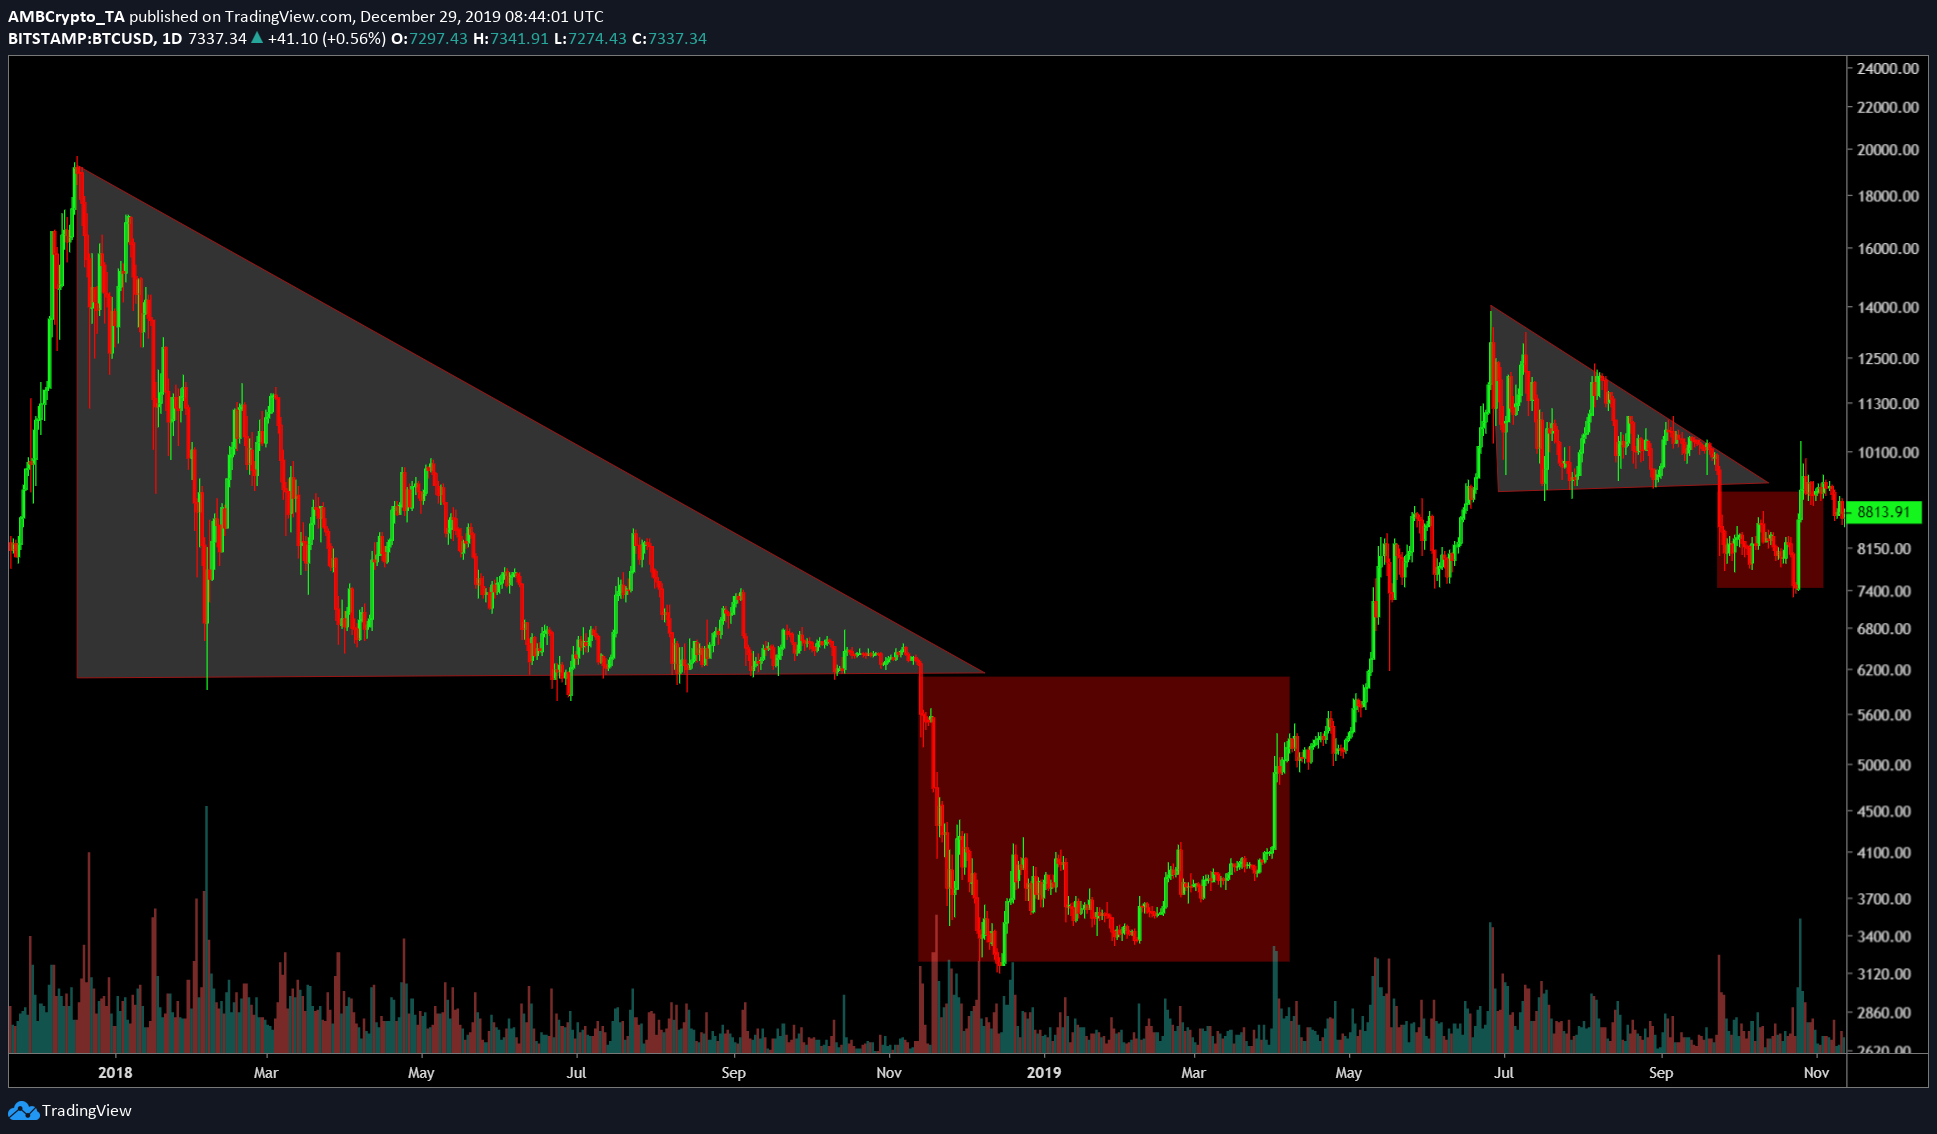
Source: BTC/USD on TradingView
Similar patterns can still be identified in Bitcoin over different timescales. For this purpose, 2019 is split into 4 phases,
- Period of excessive stagnation – January 01, 2019, to April 01, 2019
- Period of excessive growth – April 01, 2019, to June 26, 2019
- Period of correction – June 26, 2019, to September 24, 2019
- Period of extended correction – Septemeber 24, 2019 to date
Period of excessive stagnation
The period saw Bitcoin moving sideways. The price had just spiraled from $6,000 to $3,000, BTC was trying to recover from this massive collapse and hence, the sideways/stagnation. Moreover, this period is observed to have huge pumps and dumps in succession, especially on the 4-hour chart. These pumps and dumps can also be categorized as BART patterns.
To most, this period was the accumulation phase as the price had collapsed from a whopping $20,000 in December 2017 to a shocking $3,000. There was widespread miner capitulation, rampant FUD and fear in the community. Most altcoins and projects got obliterated to dust in this period.
Period of excessive growth
In hindsight, the rise in April 2019 wasn’t a mysterious concept. However, the surge in April came as a shock to most people in the community. No one could explain the sudden rise. While some attributed it to Asian markets, others stated that it was a fool’s rally and a bull squeeze. To everybody’s surprise, the rally did not stop as it kept growing in size, exponentially, with each passing month. There was a paradigm shift during this phase as the bearish momentum flipped and became bullish.
The growth hit a ceiling on June 26, 2019, when Bitcoin reached a staggering $13,800. A 242% rise in under 86 days. Bitcoin showed everybody why it was a whole new game. Moreover, this period showed excessive growth when compared to the previous phase as the surges were much higher, easily more than 7% [highest pump/dump in the previous phase].
The excessive growth phase had no patterns forming as this was an unnatural rise in Bitcoin’s price. It was also a mini bull-run encapsulated within an extended bear cycle.
Period of correction
This period’s correction lasted for 3 months and it ended with a massive drop in Bitcoin’s price. Bitcoin corrected by 42% in this phase as the price fell from $13,800 to $8,000. Just like the rally that preceded it, this dump was also uncontrollable. An interesting observation here is the fractal within Bitcoin’s bear cycle, as mentioned above.
Unlike the period of excessive growth, it was possible to do a technical analysis of Bitcoin. There were various patterns being formed in this phase, falling wedges, Bart patterns, rising wedges, etc.
Period of extended correction
As the name suggests, this period was Bitcoin’s journey to find the second bottom, a foothold, so to speak, for it to rally higher. Although the halving is a few months away, the price seems to be dropping, which is a complete negation of the narrative surrounding halving.
Speaking to AMBCrypto, Digitalik.net, a Bitcoin analyst, stated,
“History has shown to us two times already that halving is very important event so I don’t believe this time would be any different. If miners are to continue mining 50% less with same amount of hardware, electricity and manpower then this has to affect the price. The question is how big the magnitude will be but nobody can say this.”
This phase consisted of multiple Bart patterns occurring in succession, rising and falling wedges, etc. At press time, the price of Bitcoin hovered below the $7,500 level, with Bitcoin dominance at 68.6%.
Good Tidings for Bitcoin in 2020?
According to “ChartsBTC,” based on Bitcoin halving cycles, the price of Bitcoin is supposed to hit anywhere between $29K to $47K in 2020. With respect to the fast-approaching halving, Digitalik.net added,
“I believe halving will have impact. The only question is – how big.”
On the adoption front, Bitcoin still has a long way to go. Although built as a decentralized peer-to-peer currency, Bitcoin is still far away from achieving this goal. Even with second-layer solutions, Bitcoin is still nowhere close to speeds [transaction finality and settlement] that the traditional financial infrastructure provides. As an example, Bitcoin’s tps is exponentially lower than what XRP and its blockchain can provide.
As for what the price of Bitcoin is going to be in 2020, nobody knows. As the price of BTC hovers in the $7,500 region, it could explode any minute and start its bull run, or it could sink lower, perhaps, hitting the same bottom as in December 2018. However, some people in the Bitcoin ecosystem are still bent on seeing BTC rally before the halving event, which is scheduled for May 2020.