Bitcoin could appreciate by 5% over the next week

Bitcoin managed to stay above the $9600 level for most of this month, shuttling between $10,000 and $9500 as the days went by. While February’s Bitcoin price movements have been reasonable at best and disappointing at worst, Bitcoin’s short-term might be in for a brighter future.
Bitcoin 4-hour chart

Source: BTC/USD on TradingView
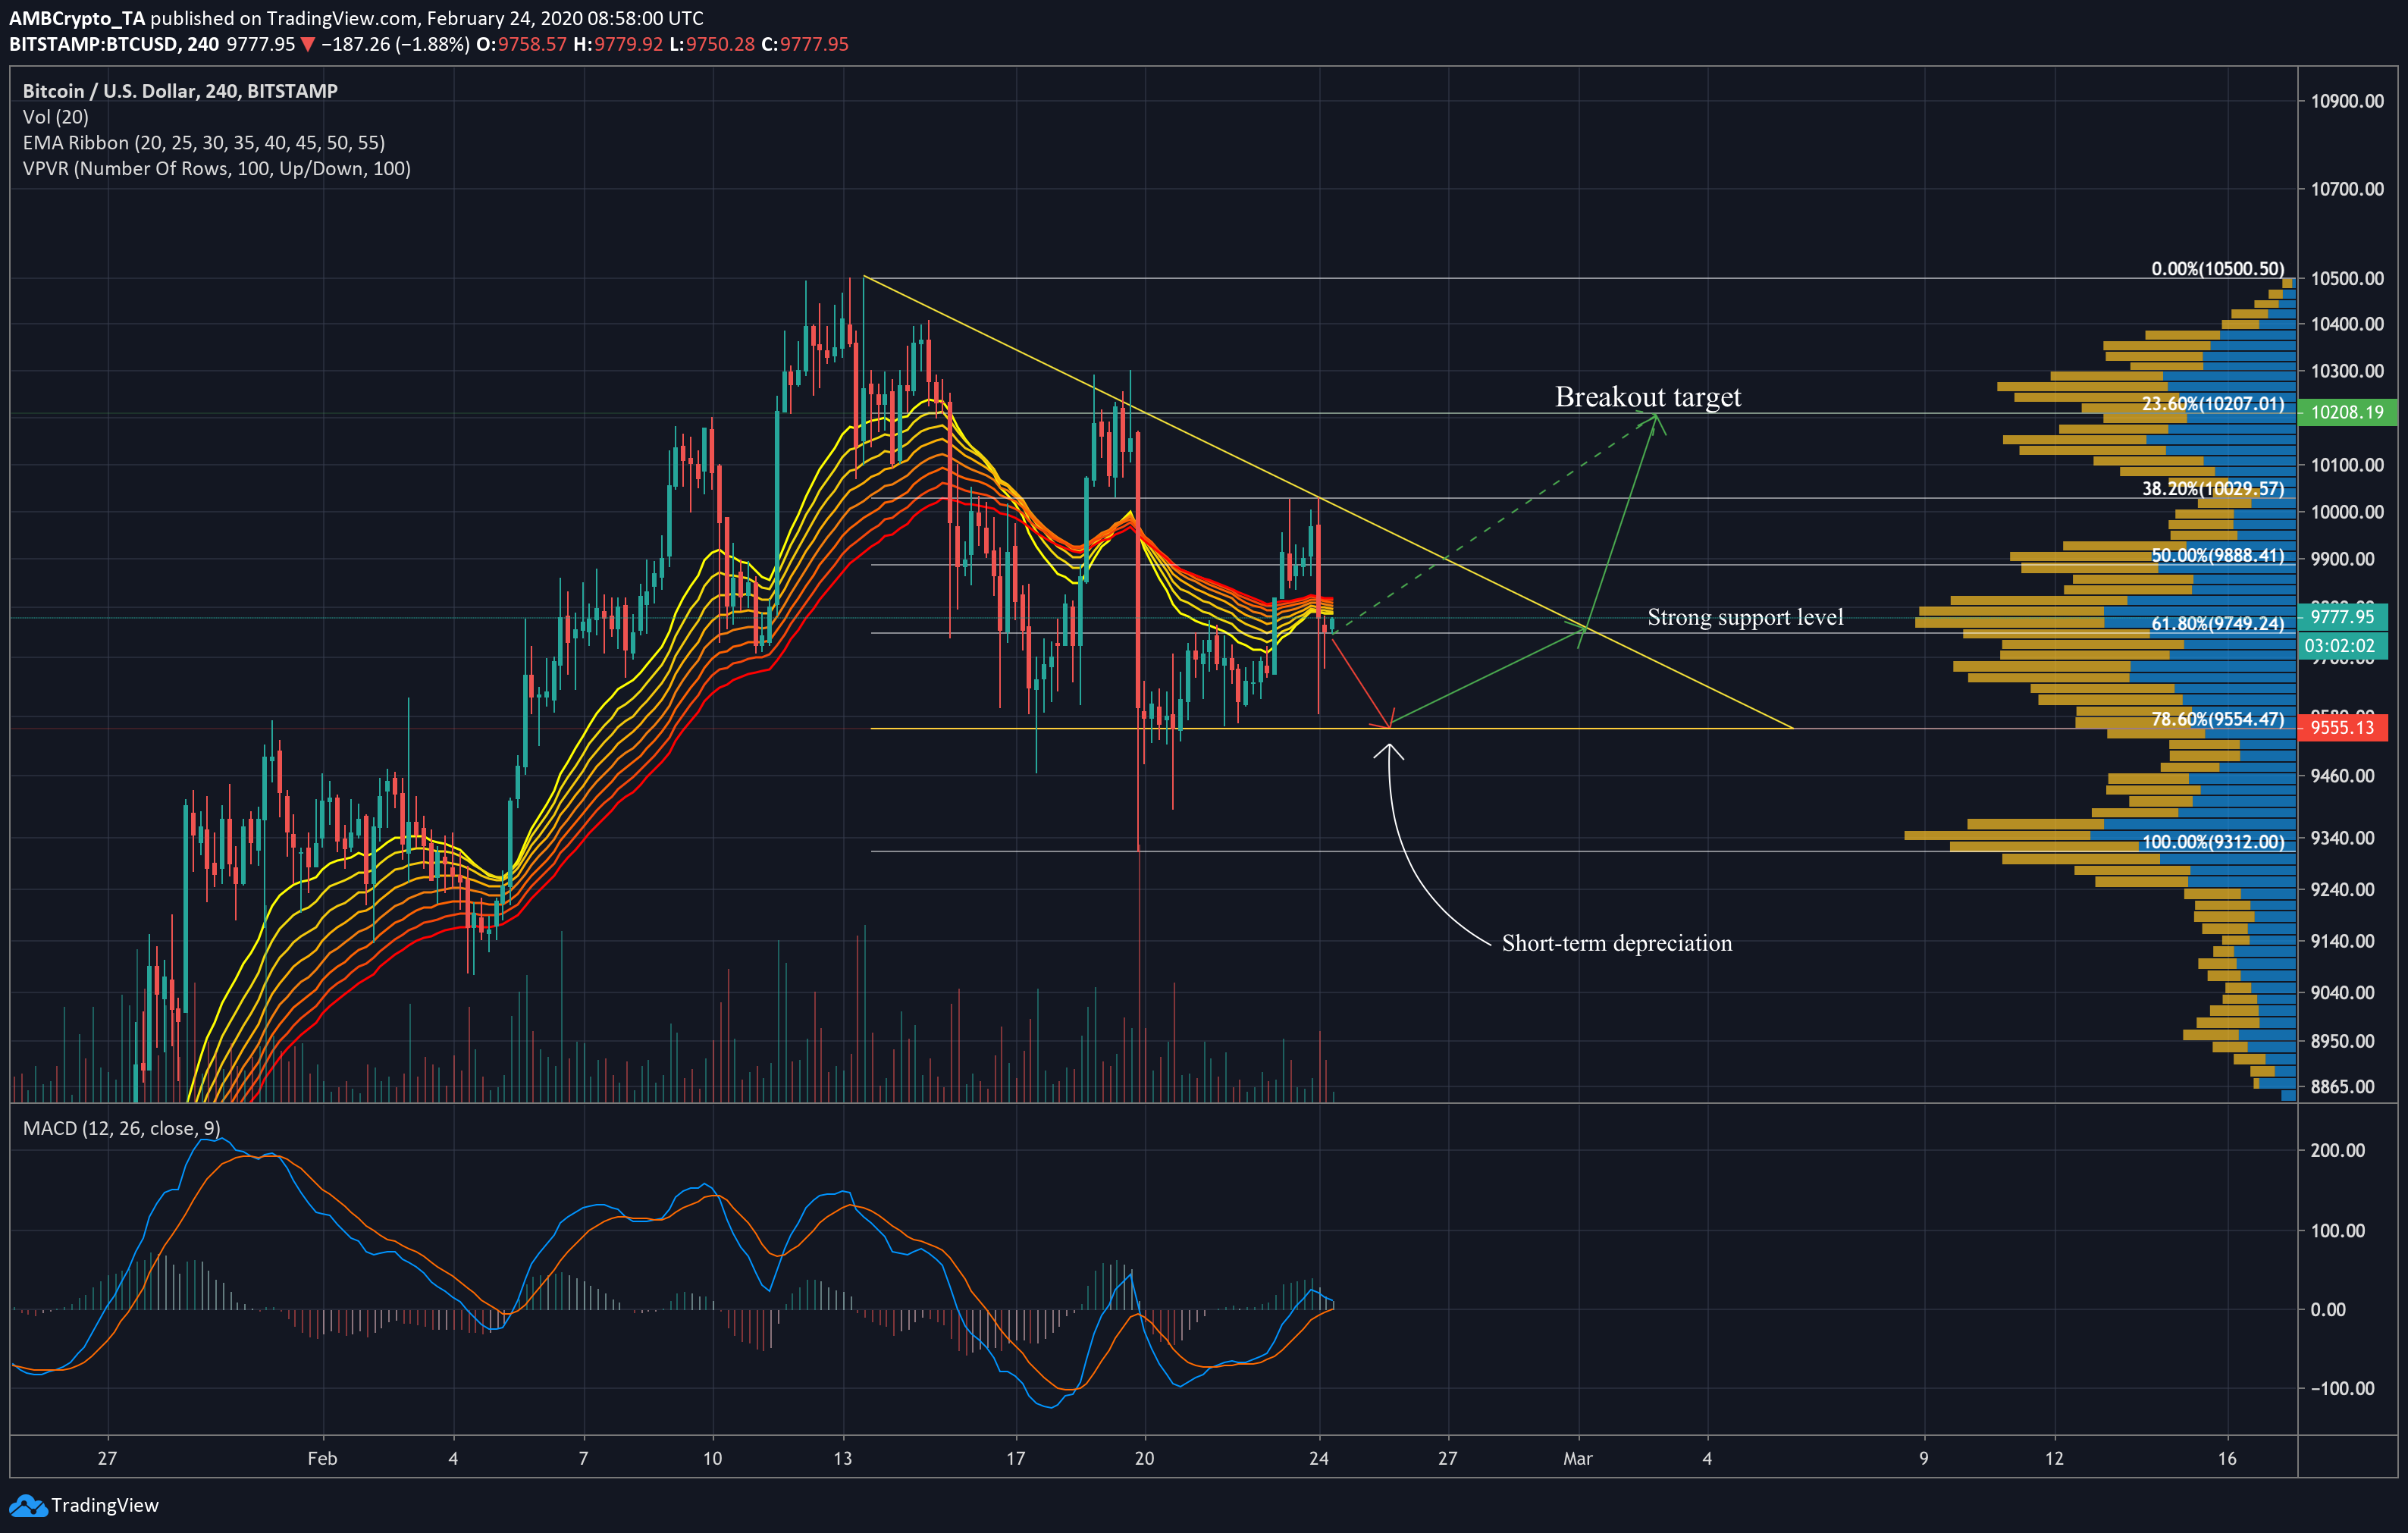
Bitcoin appeared to have entered a descending triangle formation following the second week of February, alongside a receding volume trend that is usually seen accompanying this type of pattern. Descending triangles breakout upward 53% of the time, leaning slightly towards a higher probability of appreciation in the short to medium-term.
After briefly touching the $10,000 mark recently, Bitcoin spiked under the $9750 line, a level of strong resistance. While the latest candle appeared to be pushing upwards, some brief downward movement could be in store. The EMA Ribbon lines were also seen moving just above the latest price candle and they could act as resistance to the price over the next few days. Further, the incoming expansion of the ribbon lines from the mean reversion could see heavy losses in the days to come.
Though the MACD presented a bullish scenario, the faster moving average had dipped downwards and could indicate a bearish crossover soon. Bitcoin saw high levels of support at the $9600 level as well and will likely not pull under the pattern’s lower trend line in the near future. A bounce up from this level seems plausible and could rally the price back up to the breakout point, at the $975o level by the end of the month.
From here, Bitcoin will probably pump to the 23.6% Fibonacci retracement line at $10,200 in the days that follow.
However, if the price manages to stay above the $9750 level, the expansion of the EMA Ribbons could act as supports, facilitating faster growth of value and a push to the $10,200 level directly.
MVRV Ratio

Source: CoinMetrics
The market value to realized value ratio (MVRV) compares the cryptocurrency’s market capitalization to its realized cap — the value of all BTC in circulation at the time they were last transacted. For Bitcoin, when this value is less than 3.7, the asset is said to be bullish and undervalued. Bitcoin’s MVRV ratio has been rising since the start of the year and it is still well under the threshold value, which could mean that BTC will rise in the short-term.
Conclusion
The $9750 level will likely act as heavy resistance and could cause some short-term depreciation for Bitcoin. This could contribute to a dip below the $9600 level at the pattern’s lower boundary. From here, a push back to $9750 could facilitate a breakout to the $10,200 level by the first week of March. However, if the price manages to breach the $9750 level, the EMA Ribbons’ expansion could carry BTC directly to $10,200, avoiding the dip to come.
Bitcoin’s rising MVRV ratio, which was still well under the 3.7 mark, at press time, could also indicate bullish movements in the short to medium-term.


