
Bitcoin Cash has soared more than 65% since its dip on 13 March. Considering BCH’s surge, what seemed like a mass dump at the time, has since played out well for the token. At press time, the token was steadily trying to stay above the centerline of the upsloping channel, trading at $227.
At the time of writing, Bitcoin Cash was indicating a short-term rise in the one-hour chart. The same can be said about BCH’s prospect over a longer timeframe.
Daily Chart
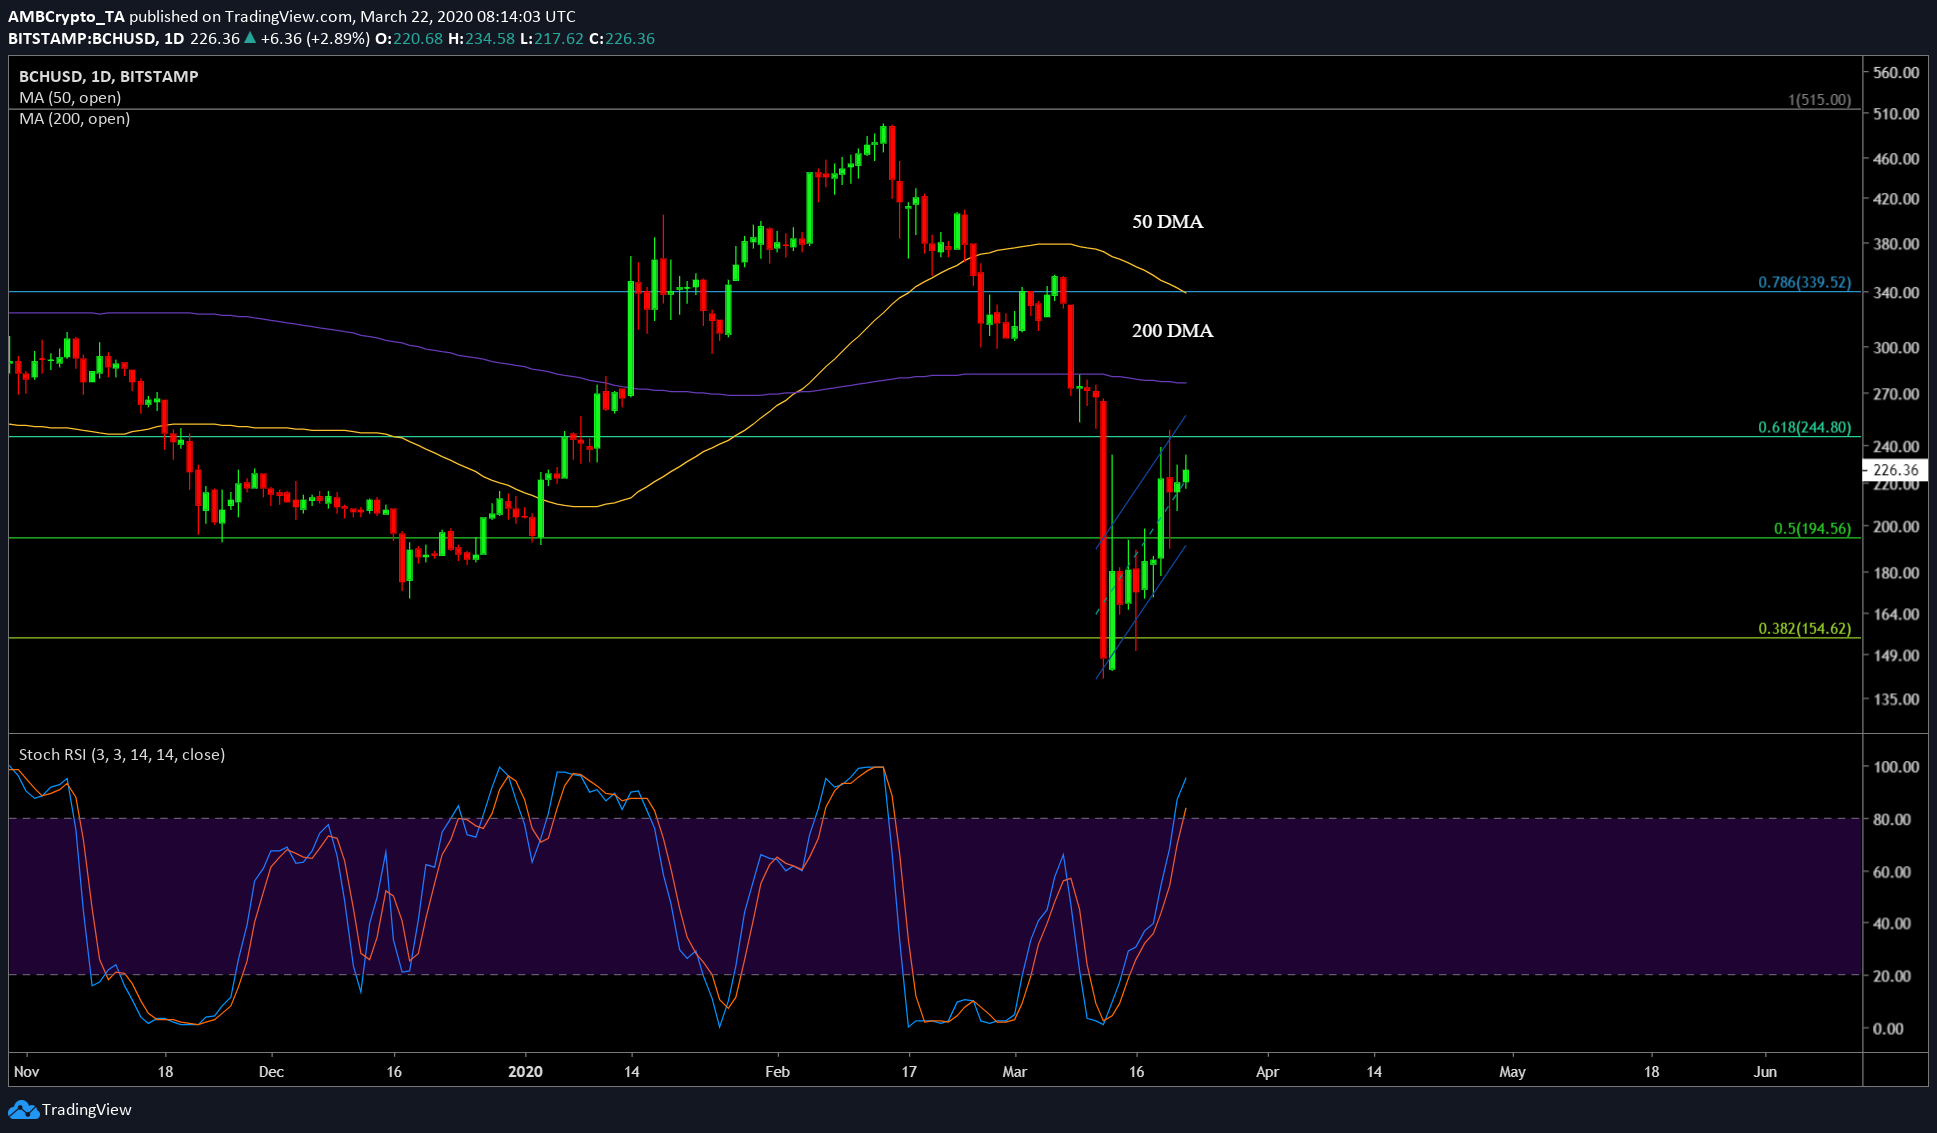
Source: BCH/USD on Trading View
The one-day chart for BCH showed a sharp surge after 13 March’s collapse. The price bounced from 38.2% Fibonacci level as seen above, and conquered the 50% level, while aiming for the next level. With a failed attempt to breach the 61.8% on 20 March, the price was stuck in an upsloping channel which indicated a bearish breakout in the near-term.
Further, the 200-Day MA and the 50-Day MA are both nearing each other; however, a move of the 50 DMA below the 200 DMA would be uber bearish. Take, for example, XRP, which underwent a death cross recently. However, completion of this pattern with a resulting downward breakout would bring this death cross one step closer to reality.
For now, the upside on a higher time frame seems to be at $244.80, with a downside up to $194.50.
Hourly Chart

Source: BCH/USD on Trading View
A closer look at the upsloping channel indicated that there are three possibilities for this channel to break out into. The first possibility favors the bears due to the inherent nature of an ascending channel. This would push the price from $227 to 50% Fibonacci level aka $194.56, a further bearish pressure would push the price down to $170 and to 38.2% Fibonacci level at $154.
A bounce from the centerline of the ascending channel and an eventual breakout would cause the price to move to two levels. The first is at $263.40, followed by $276.
Conclusion
For both the one-day and the one-hour time frame, the stochastic RSI is indicating an end for the overbought zone. A bounce from this level would push it towards the oversold zone, further solidifying the bearish scenario highlighted above. However, a wildcard scenario would be for Bitcoin Cash to pump and this would happen in the case of Bitcoin starting to pump too.