Bitcoin Cash rose to test its resistance at $245, with the crypto expecting to note a minor pullback before another rise above its resistance. Synthetix Network Token was quite volatile in the short-term, but was likely to lose a strong level of support in the coming days. OKB was in a phase of consolidation and showed no sign of breaking out to either side.
Bitcoin Cash [BCH]
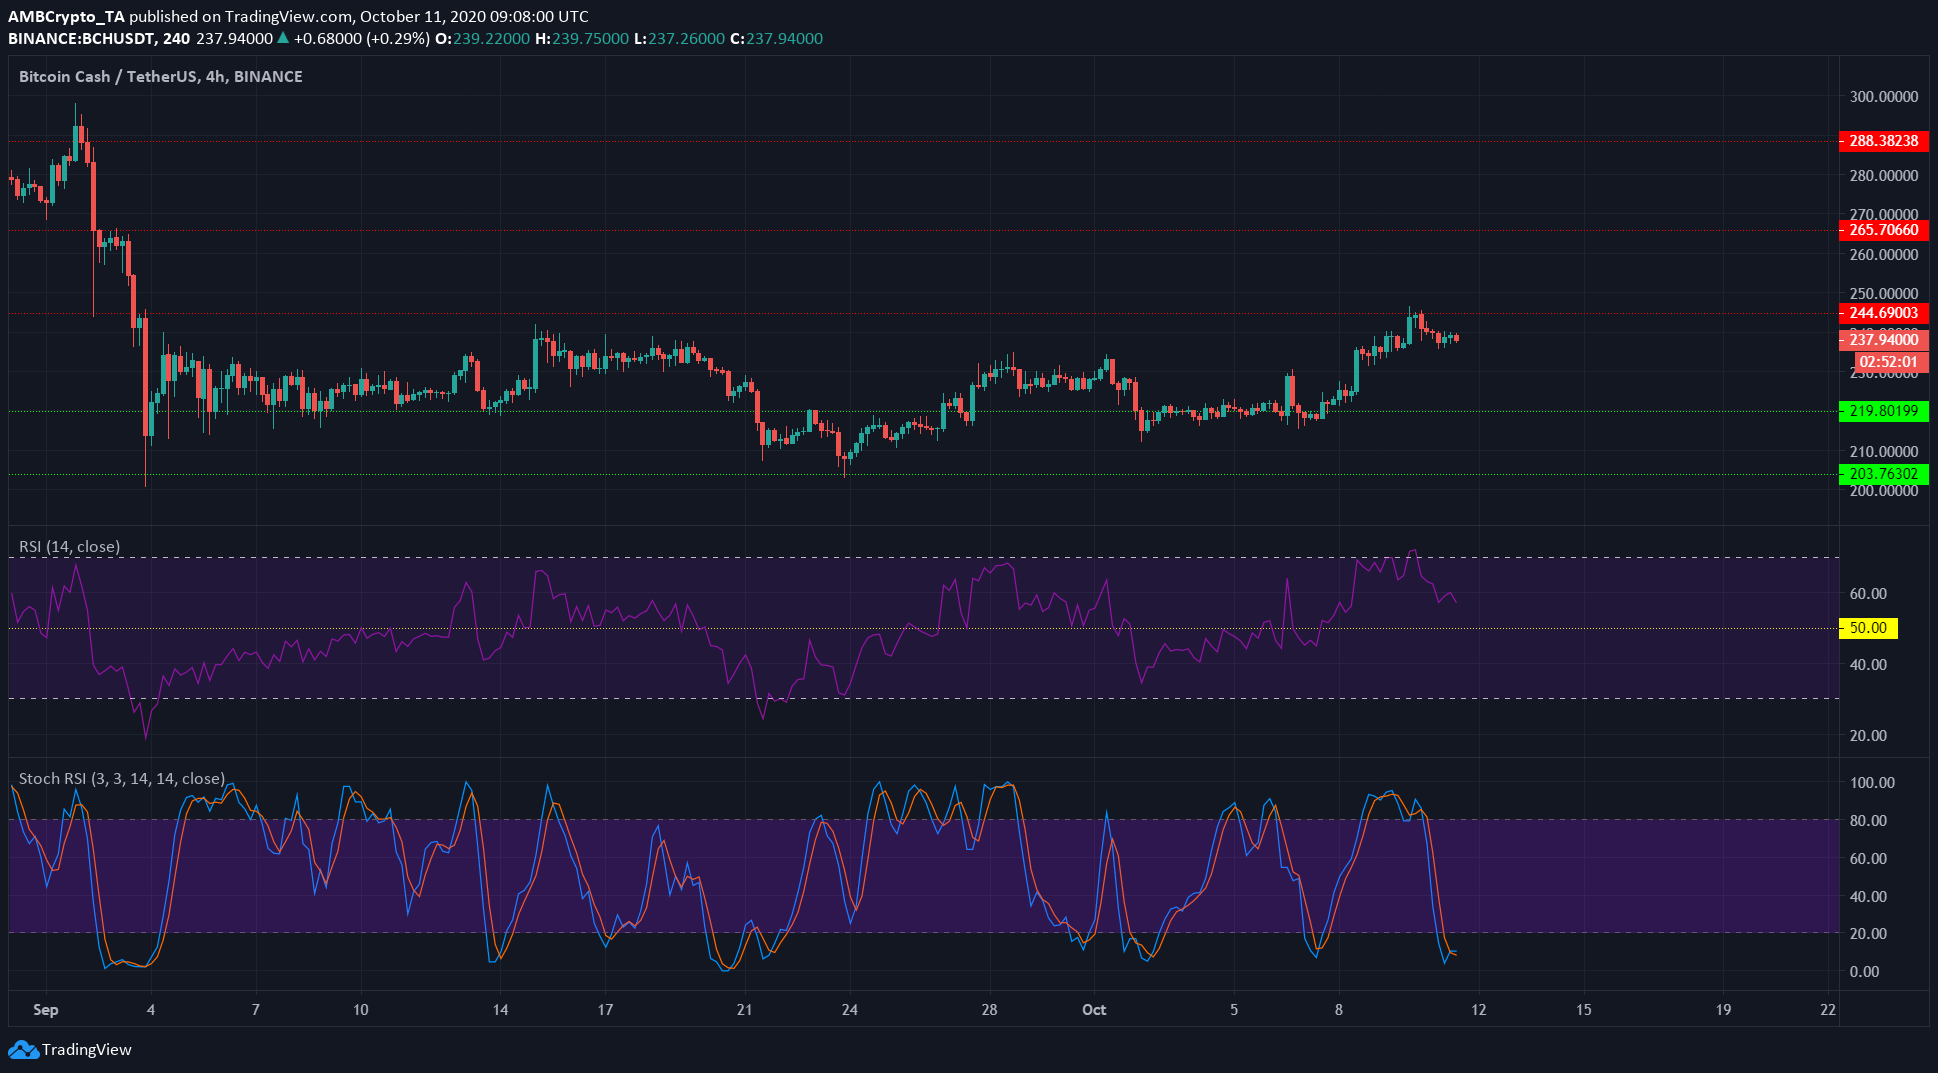
Source: BCH/USDT on TradingView
The RSI for Bitcoin Cash stood at 58, at the time of writing, with the same pulling back from the oversold zone on the chart. However, the RSI had stayed above the neutral zone over the past few days, lending weight to BCH’s brief uptrend from its $220-support level.
The Stochastic RSI was moving toward the oversold zone, suggesting that BCH might continue moving upwards after completing a minor pullback.
The zone around the $233-level has seen good volumes of trading activity and could serve as a good level of support.
Synthetix [SNX]
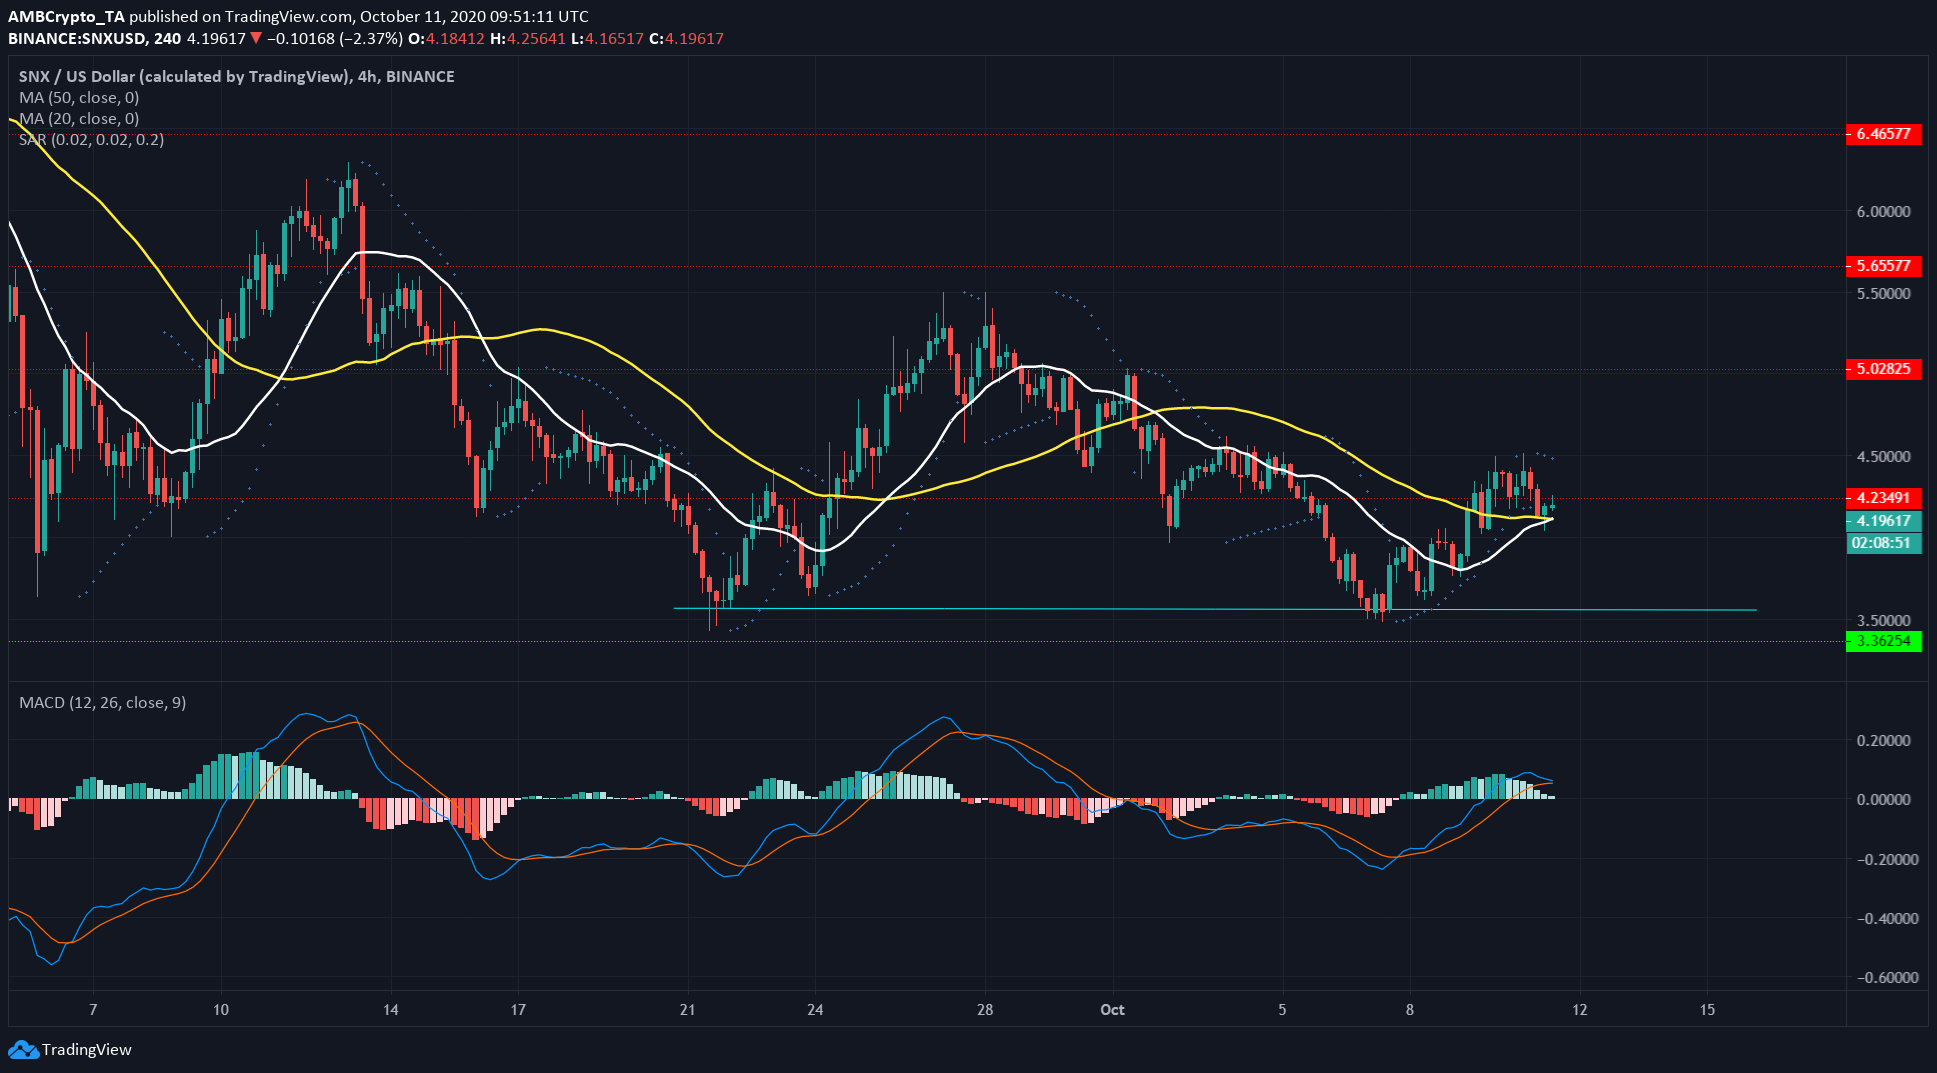
Source: SNX/USD on TradingView
Synthetix’s indicators gave mixed signals. The MACD was above zero and still presented a buy signal, at the time of writing. Further, the Parabolic SAR gave a sell signal and the 20 SMA (white) appeared to be on the verge of crossing above the 50 SMA (yellow).
This only showed that SNX had been quite volatile over the past few days, with its drop to $3.57 and subsequent rise to $4.45 a couple of days later.
However, the past few uptrends on a shorter timeframe have actually been bounces off the region of demand at $3.6. The subsequent bounces have formed a lower high, which could prove to be an ominous sign for Synthetix’s bulls in the coming days.
OKB
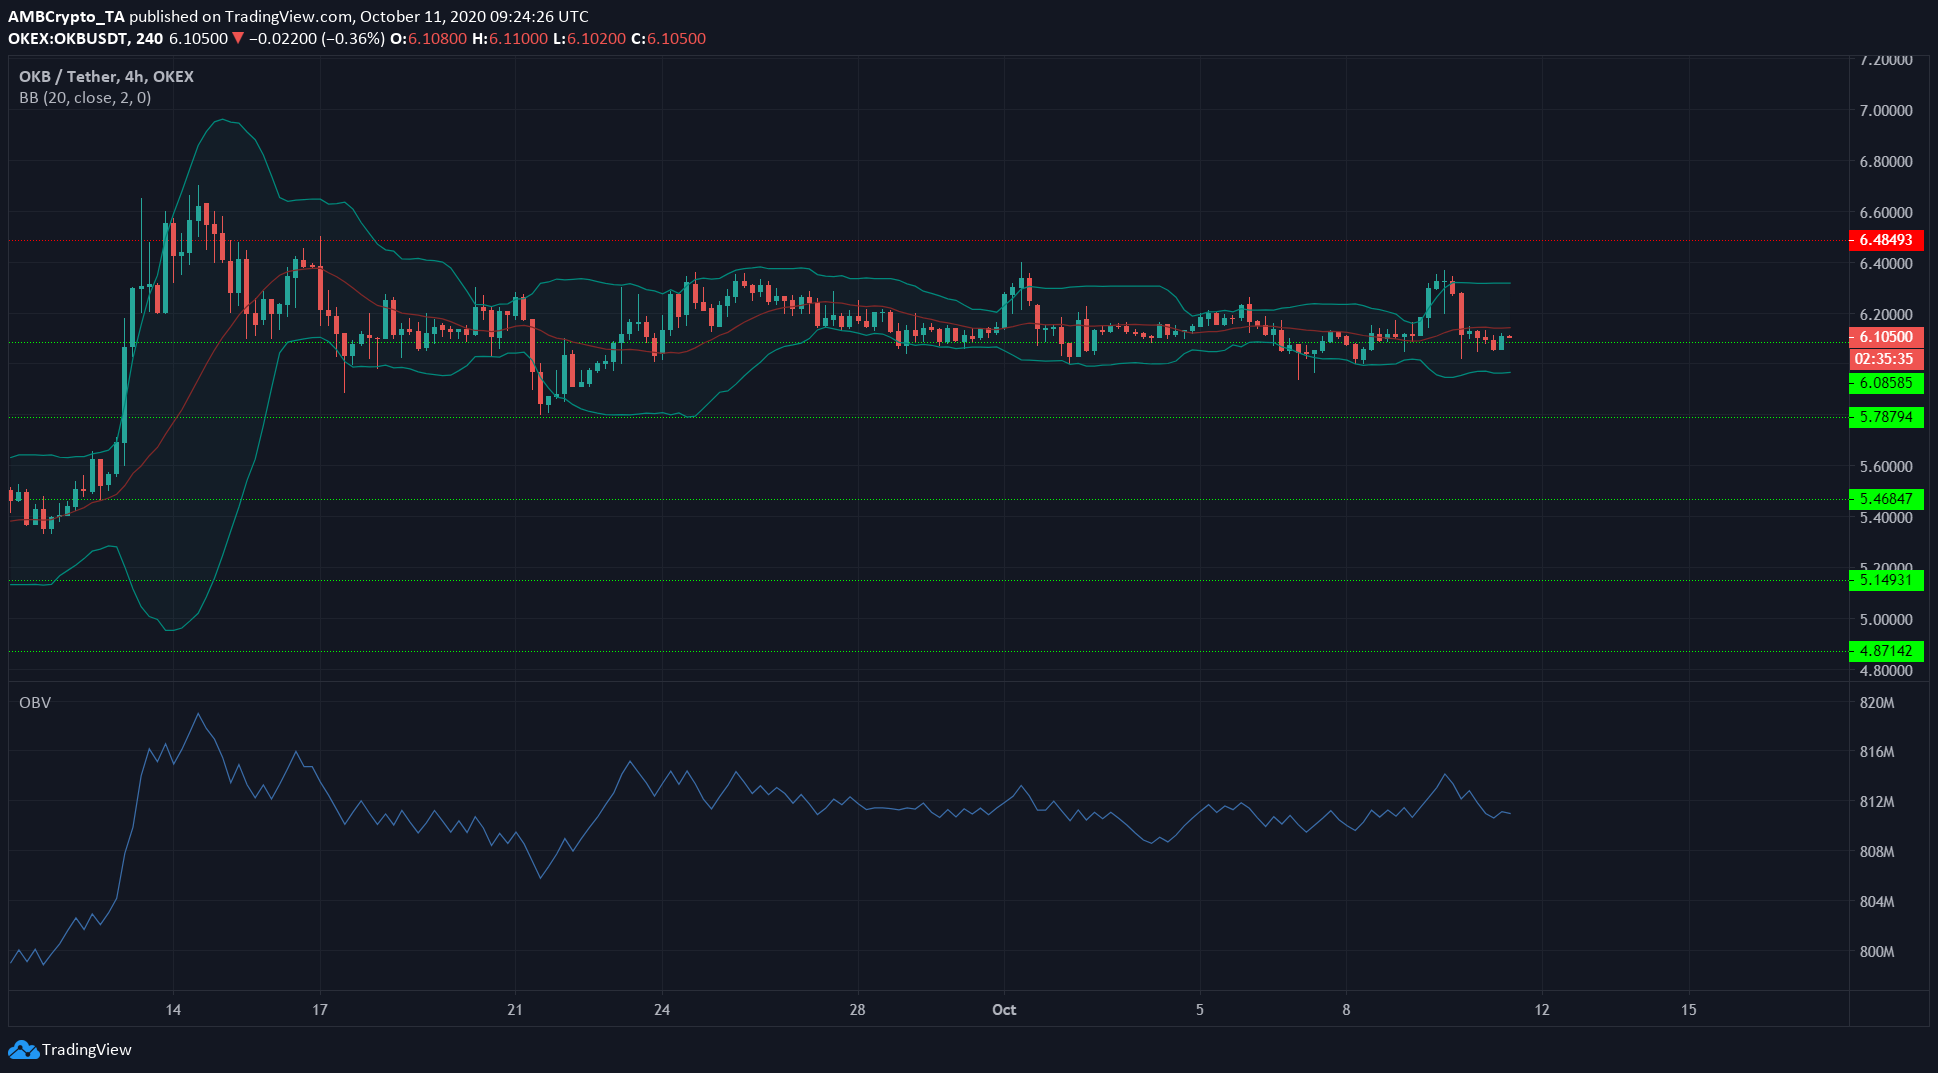
Source: OKB/USDT on TradingView
OKB was in a phase of consolidation, at press time. Its price had hardly moved in either direction over the past month, holding steady at and around $6. The Bollinger Bands can attest to this lowered volatility as well.
The OBV also backed these conclusions. In fact, the buying and selling volumes have been in balance for the past month.
A breakout to either side from this price range could be explosive, although no signs of a breakout were yet exhibited.