
Three black crows – The term itself gives one a sense of foreboding and impending doom. It isn’t the only one either, since there are others like Three inside down and Death Cross too. In fact, technical indicators and candlestick patterns today sound more like warnings than tools for predictions.
However, many analysts would argue that reading charts and performing technical analysis are the most widely employed methods for price predictions. The underlying assumption here is that historical prices have a significant weight on the present and future price of an asset. Patterns repeat themselves and historical trends emerge on the price charts from time to time. So, technical analysis increases the probability of making a profit on future trades.
However, what if there’s more to price predictions for a cryptocurrency like Bitcoin? Bitcoin differs fundamentally from traditional financial assets and instruments, especially since its volatility is higher than most assets available to retail buyers. Further, its increasing correlation with gold has fueled the digital gold narrative. It must be noted, however, that its 1-year realized correlation is nowhere close to its 3-month values.
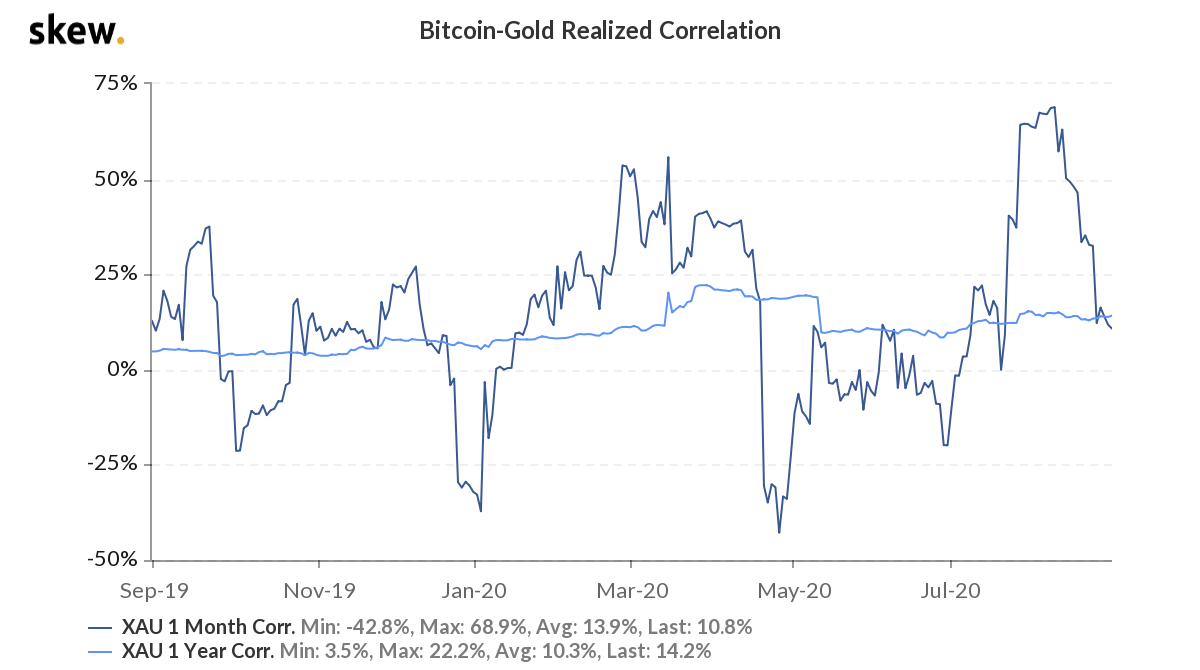
Source: Skew
The realized correlation between Bitcoin and Gold supports the argument that it may not be ideal to treat Bitcoin like traditional assets.
Ergo, what is the best way to predict Bitcoin prices without resorting to Technical Analysis?
While technical analysis, today, is undeniably the most important premise of Bitcoin price predictions, Bitcoin is a 21st-century asset and it can be argued that it should be analyzed in a new way.
Analytics 2.0
Insights into Bitcoin’s price trends are obtained by studying new indicators and tools developed solely for this purpose. Bitcoin’s blockchain generates and holds high-velocity data. It stores interactions of millions of users with each other for value exchange on Bitcoin’s blockchain. Several data points that emerge here are different from those of traditional financial assets. They are readily available for parsing and exploring correlations. Analysts across the world are developing different tools to perform on-chain analytics, while identifying sentiment and fundamental analysis.
The NVT Signal by Willy Woo, a popular Twitter influencer and on-chain analyst, for instance, is one such new-age tool. The NVT Signal (NVTS) is a derivative of the NVT Ratio by Dimitry Kalichkin. It places emphasis on predictive signaling ahead of price peaks. NVTS divides Network Value by the 90-day moving average of the transaction value to derive the NVT Signal. The result is a relatively stronger, stochastic-like indicator, one that marks tops and bottoms in price far more effectively and could be an essential tool for Bitcoin investors and traders.
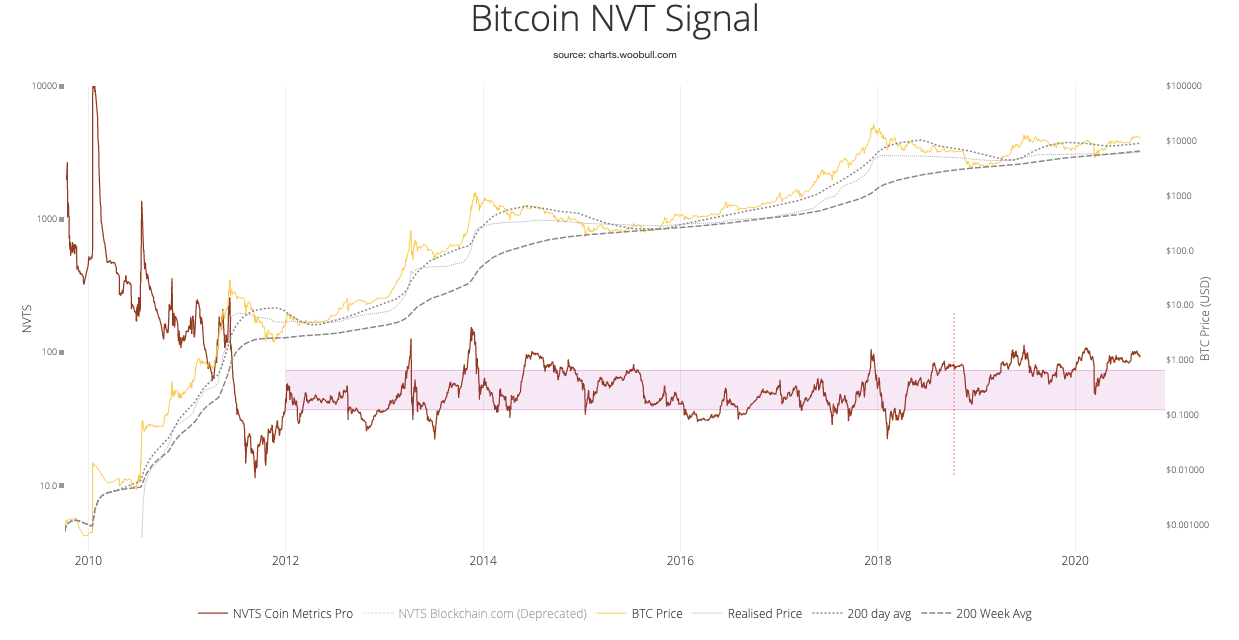
Source: Woobull Charts
Conclusions drawn from this NVT Signal’s chart are as follows,
- There is a strong correlation to tops in price and the NVT signal crossing 100. Take the example of April and November 2013, and December 2017
- There’s a strong correlation to bottoms in price and the NVT signal being under 30. Take the example of November 2011, July 2013, and February 2018
- An important point to note here is that the NVT Signal did not drop below 30 in December 2018 when the price dropped from $6000 to $3500, and this bullish divergence was a key actionable insight for traders
- As of writing, the NVT Signal was at 94, the same level in fact as the December 2017 top. This is a good indicator of the need to be cautious on spot and derivatives exchanges. A sudden influx of liquidity or a sudden drop in demand could derail the bull run
Bitcoin is a Generation-Z asset and it requires a fresh perspective for price predictions. As a security layer, its price can be measured with objective value indicators. However, when the price moves away from the predicted pattern, there’s a potent force influencing it, like a wound string. The string is bound to unwind, and similarly, the price will fit the pattern again.
There may be a few hiccups in the trend, however, something that explains Bitcoin’s volatility. But, every time the string winds up, there’s a buying opportunity. New-age metrics like NVT Ratio, CDD (Coin Days Destroyed), and MVRV Ratio should be used by crypto-analysts for predicting such opportunities. These compelling metrics power Bitcoin Analytics 2.0.