Bitcoin’s halving was a success in this very unexpected way

Let’s be honest – 2020 is not going the way you thought it would.
If you had taken a look at the calendar before the start of the year, what would you have reckoned would be the monthly volatility of Bitcoin? How do you think the largest cryptocurrency in the world would’ve navigated what was potentially the most pivotal year in its short history?
Compared to its previous price-heavy years, 2020 was slated to be one of the most important. After a year in the crypto-winter in 2018, sandwiched between two bullish years of 2017 and 2019, the sentiment heading into 2020 was buoyant. However, COVID-19 and the subsequent market crash changed everything.
On 12 March, Bitcoin dropped by close to 50 percent, undoing months of maturation and price discovery before it. The events of ‘Black Thursday‘ accompanied the single worst price drop in the past seven years of the cryptocurrency’s history. What was worse was that it came almost two months to the day before the third block halving, an event that was expected to have a massive price effect.
While the pre-existing notion was the halving would make the market more volatile, it did the opposite.
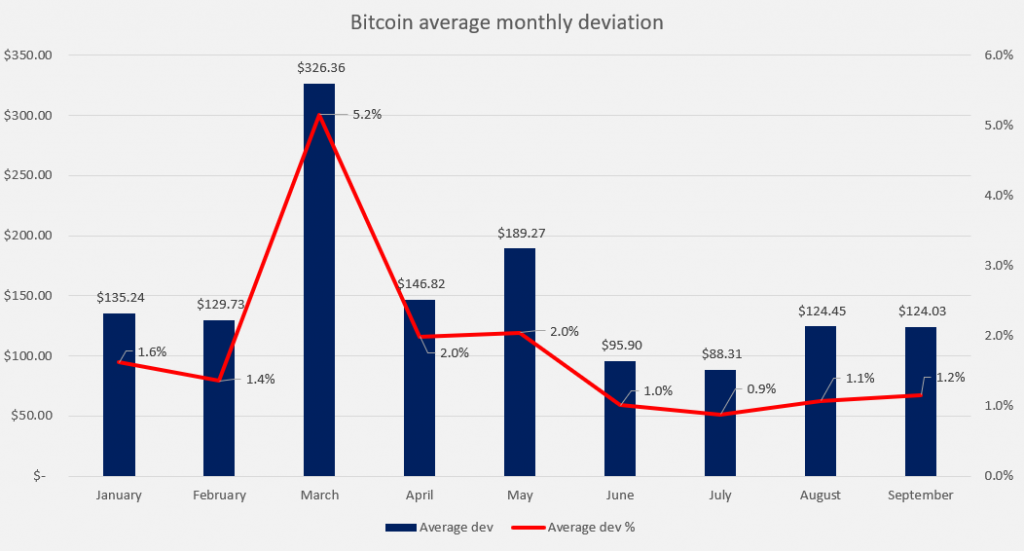
When analyzing Bitcoin’s price movements from the beginning of the year to the end of September, it was observed that the most volatile month was March, and not May.
In March, the average price deviation for all thirty-one days of the month was 5.2 percent per day, which was massively higher than any other month of the year. In comparison, the two succeeding months of April and May took the runner-up spots for deviation on average by 2 percent. This massive 3.2 percent difference between the first and the second most volatile months underscores how volatile the month of March truly was. On average, on each day in March, Bitcoin moved (either up or down) by $326.3. Now, compare this to June, a month during which on average, Bitcoin moved by less than $96!
Going down the list, the volatility only fell from May, with June, July, August, and September having an average daily price volatility of 1 percent, 0.9 percent, 1.1 percent, and 1.2 percent, respectively.
To compare this to a before the halving and after the halving perspective – Bitcoin’s pre-halving daily volatility on a monthly basis was 2.5 percent, thanks in large part to March, and Bitcoin’s post-halving daily volatility on a monthly basis was just 1 percent, a full 150 basis points lower!
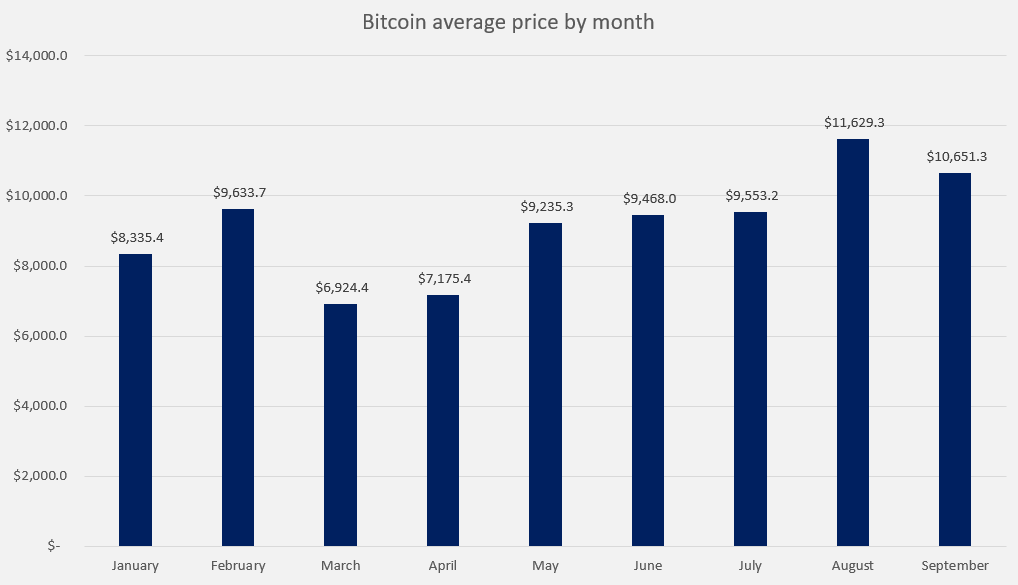
Looking at the average monthly price, unsurprisingly, August had the highest with a consistent trend over $11,000 and March had the lowest. The average rose from March to August, before September’s crash below $11,000 pushed it below.
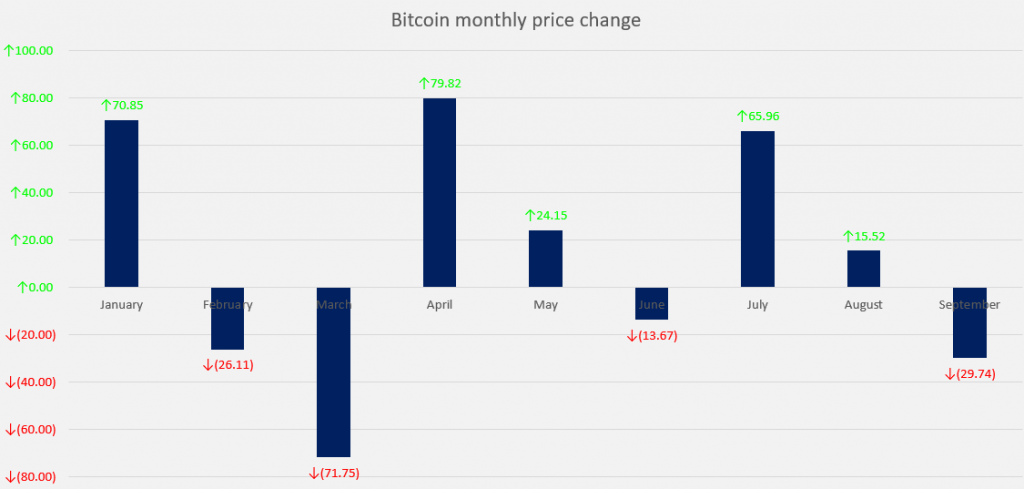
In terms of positive and negative months, the spread is fair. Four of the nine months had an average difference in the negative – February, March, June, and September, while the rest had an average difference in the positive. What this means is that for four months in the year, the average difference on a day to day basis was in the negative, meaning the overall trend was down and vice versa for the rest of the five months.
What does this mean from where we’re at now? Well, for starters, Bitcoin’s daily price volatility has decreased by a lot since March, especially after the halving, once the price had recovered sufficiently. Further, this stability has not been without strong performance. Bitcoin’s average price has improved significantly month on month since May, dropping only once in September.
With the price spreads decreasing every month while still moving and maintaining its upward momentum, the final quarter of the year will be more calm than crash!


