XRP long-term Price Analysis: 22 September

Disclaimer: The following price prediction should not be taken as investment advice, as it is the sole opinion of the writer.
Unsurprisingly, the collective altcoin market could not hold its own over the past 24-hours as the traditional stock market, Gold and Bitcoin stumbled. With major alts already struggling after the early September collapse, XRP’s recent march towards recovery came to an unceremonious halt.
With a decline of 6.5 percent, XRP dropped down to $0.232 at one moment. While the price is pulling up a bit at press time, XRP held a market cap of $10.4 billion in the charts.
XRP 1-day chart

Source: XRP/USD on Trading View
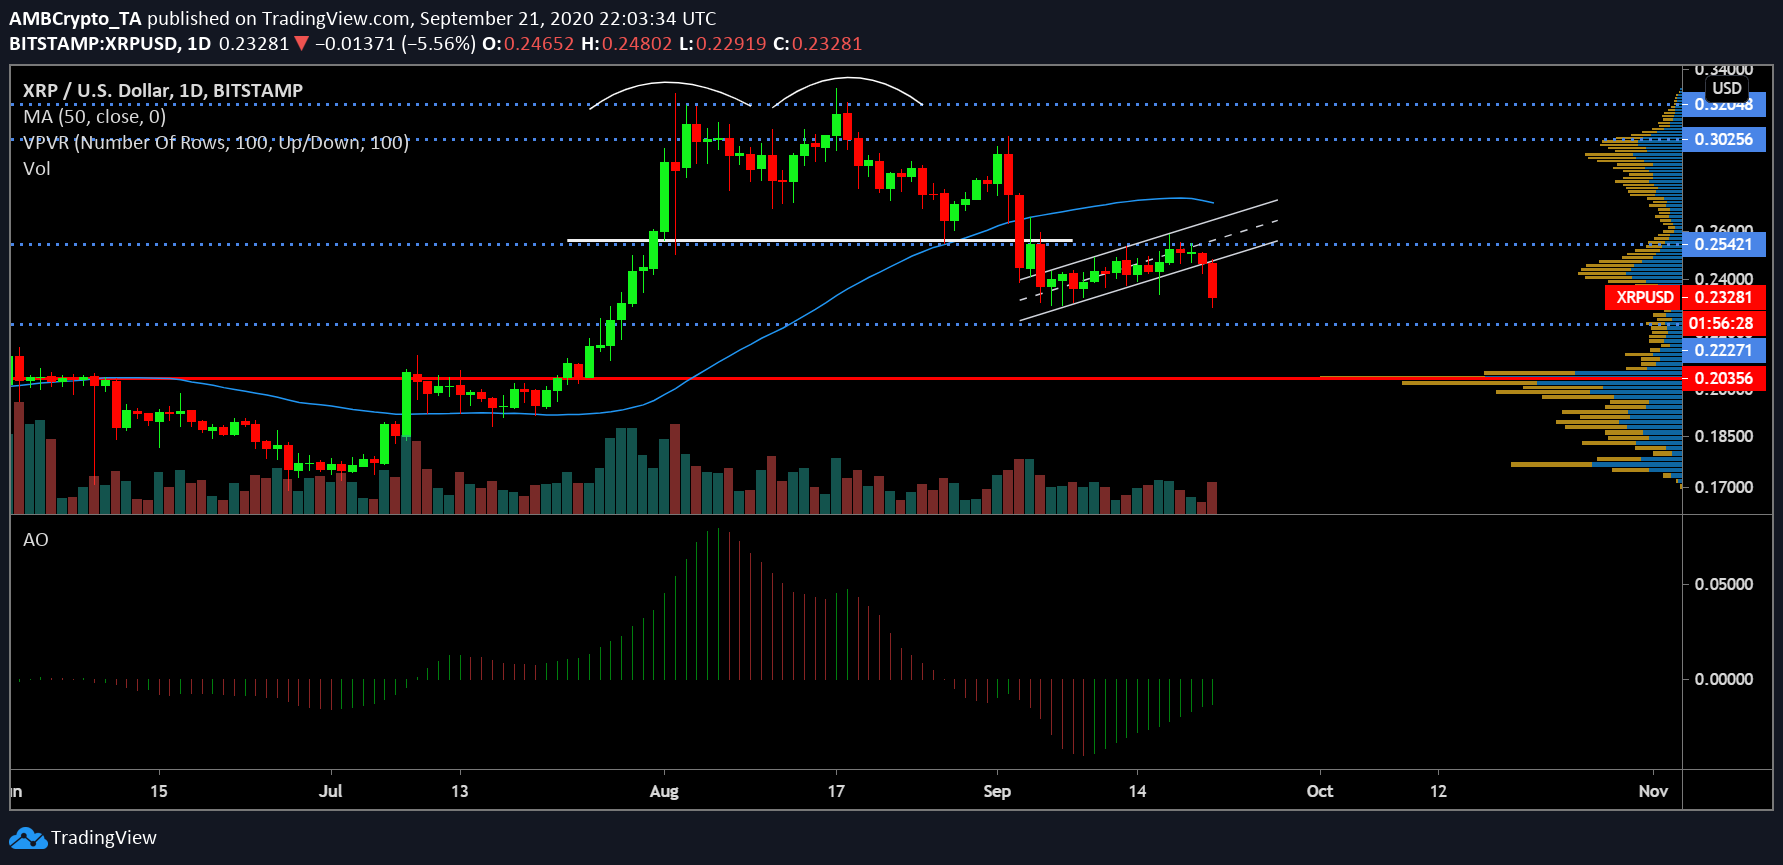
While the trigger point might have arrived from the traditional market’s decline, XRP’s daily chart suggested it was a timely bearish breakout from an ascending channel pattern. Over the past week, XRP had slowly gathered momentum to test resistance at $0.254 but the asset could not hold consolidation near the range. With the price breaking out of the pattern, it was free fall in the charts.
With immediate support at $0.222, XRP might attain a bounce back from that range. Right now, XRP’s price was as a lowly traded range according to VPVR, so the current price point was temporary. With the Awesome Oscillator indicative of diminished bullish momentum, further corrections might ensure the imminent re-test at $0.222.
Short Position opportunity?

Source: XRP/USD on Trading View
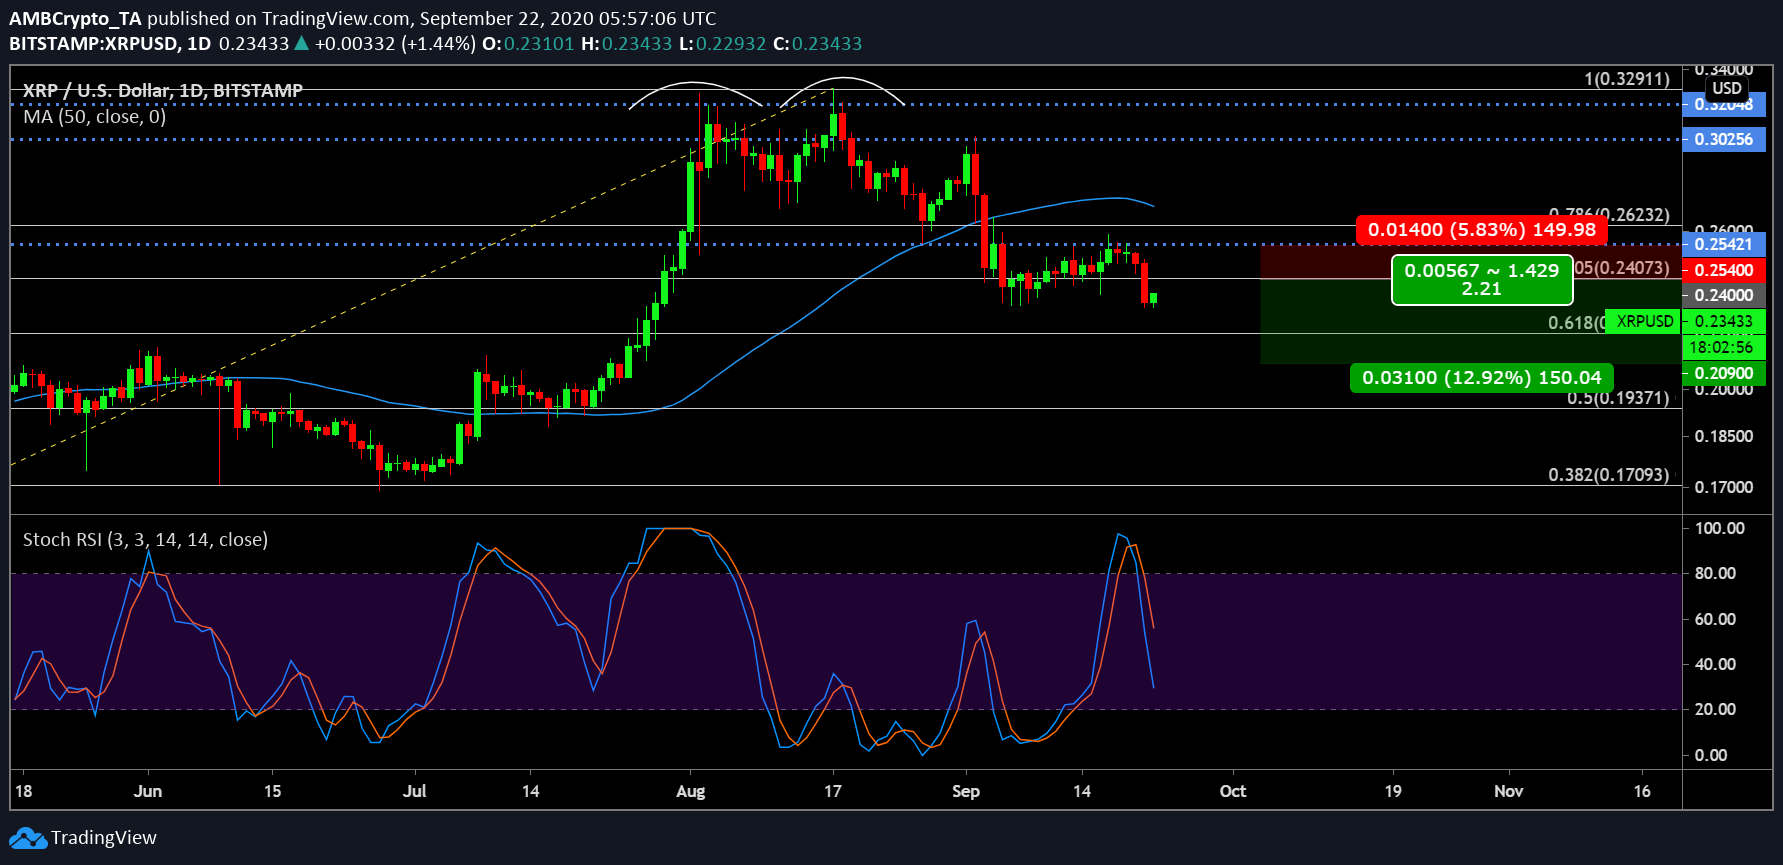
As mentioned, XRP is currently indicating a recovery on the charts so a retracement to $0.240 is fairly possible. According to Fibonacci retracement lines, 0.705 will be the point of resistance for XRP, and an entry point can be placed at this price point.
Keeping a stop loss at the next resistance of $0.254, a profitable trade can be attained at $0.209 with a Risk/Reward ratio of 2.21x. As the Stochastic RSI was already bearish, the pullback upwards might take place over the next 24-hours, before accounting for the drop.


