Algorand, Bitcoin SV, Steem price analysis: 30 August

Bitcoin SV had been on a downtrend for the better part of August; Algorand showed signs of lowered volatility and pointed toward consolidation. Steem registered large moves both upward and downward, and indicated where good trading opportunities were.
Algorand [ALGO]

Source: ALGO/USDT on TradingView
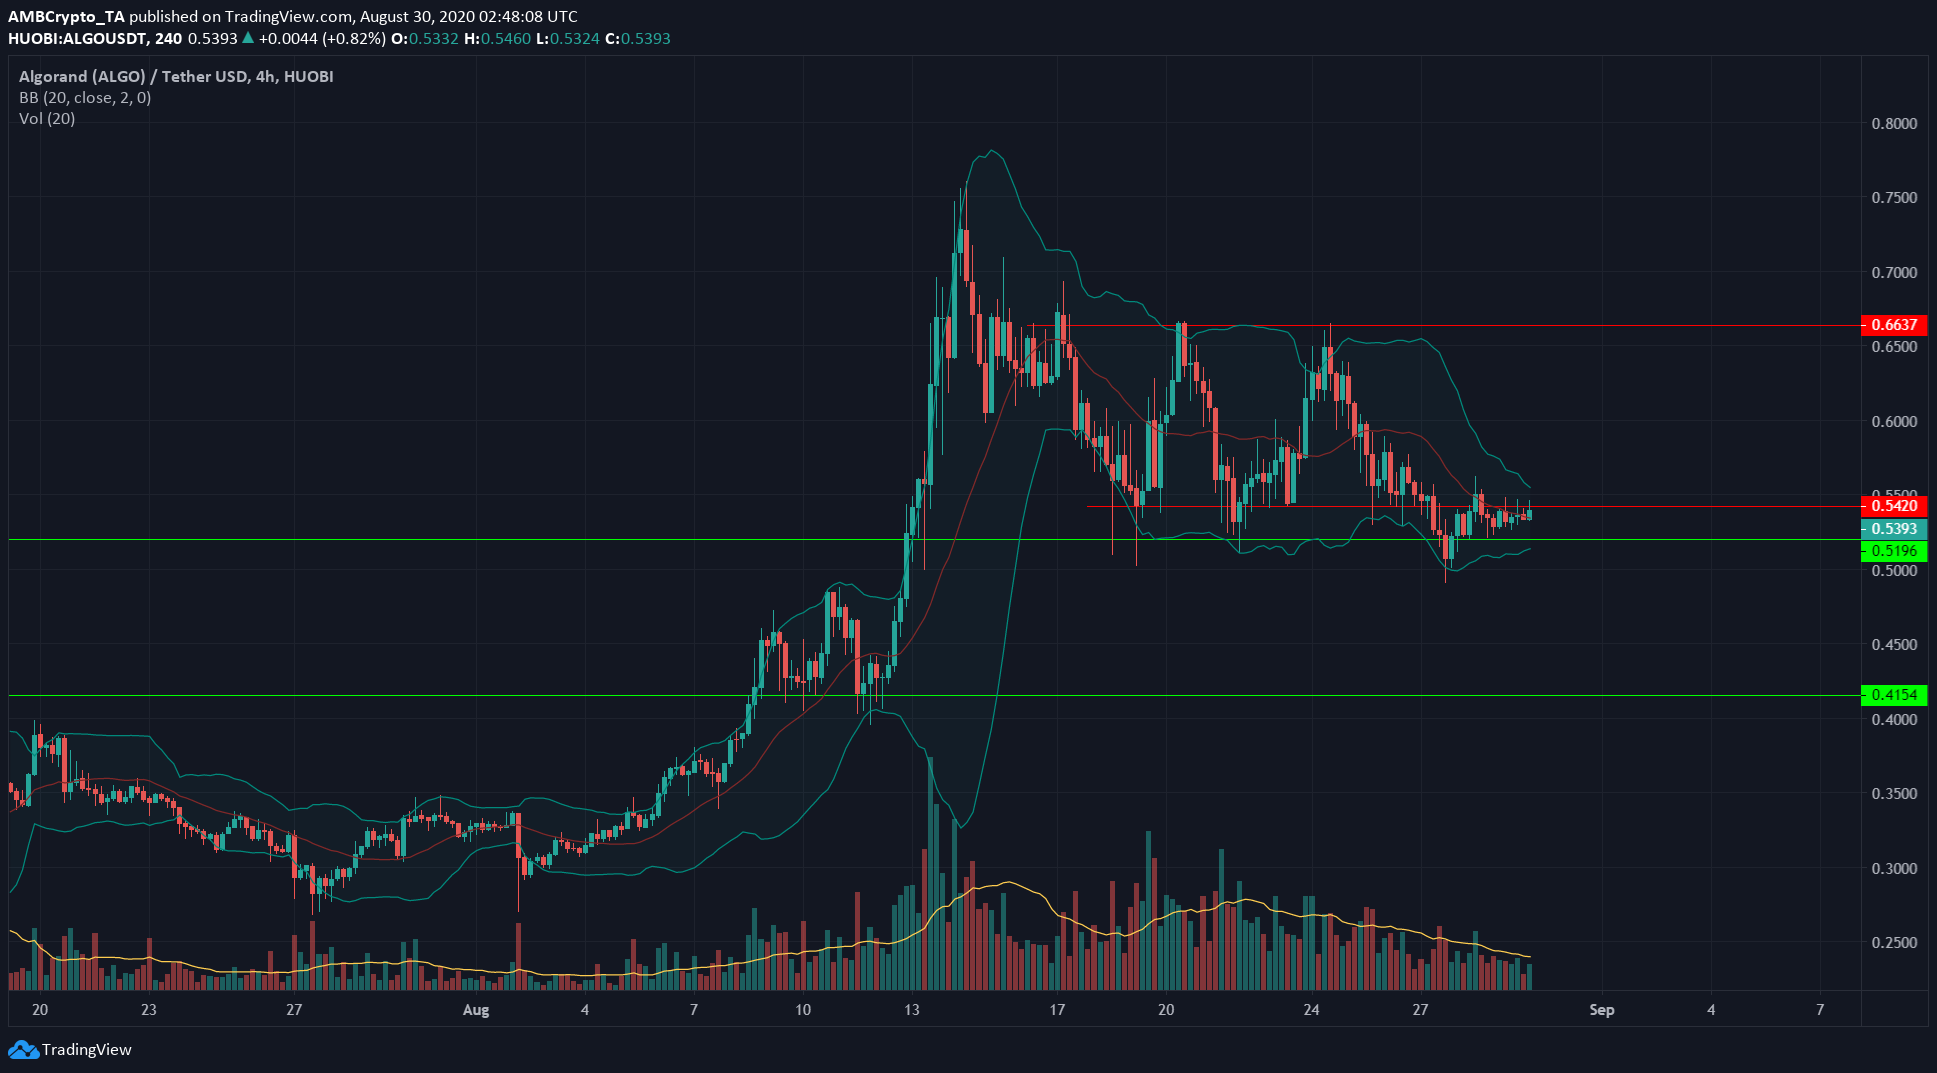
ALGO set a local high at $0.75, but was forced back. Subsequent attempts at highs found resistance at $0.66, with support at $0.52 region.
At press time, price was trading just below level $0.54, which has had significance in the past few days. Bollinger bands showed constriction. Trading volume was also decreasing. The squeeze indicated decreased volatility, and usually the asset makes a strong move up or downward after the squeeze.
Bitcoin SV [BSV]

Source: BSV/USD on TradingView
Bitcoin SV was recently in the news when Emirex, a digital commodities exchange, announced support for BSV on its platform, and introduced BSV/USDT and BSV/EUR trading pairs.
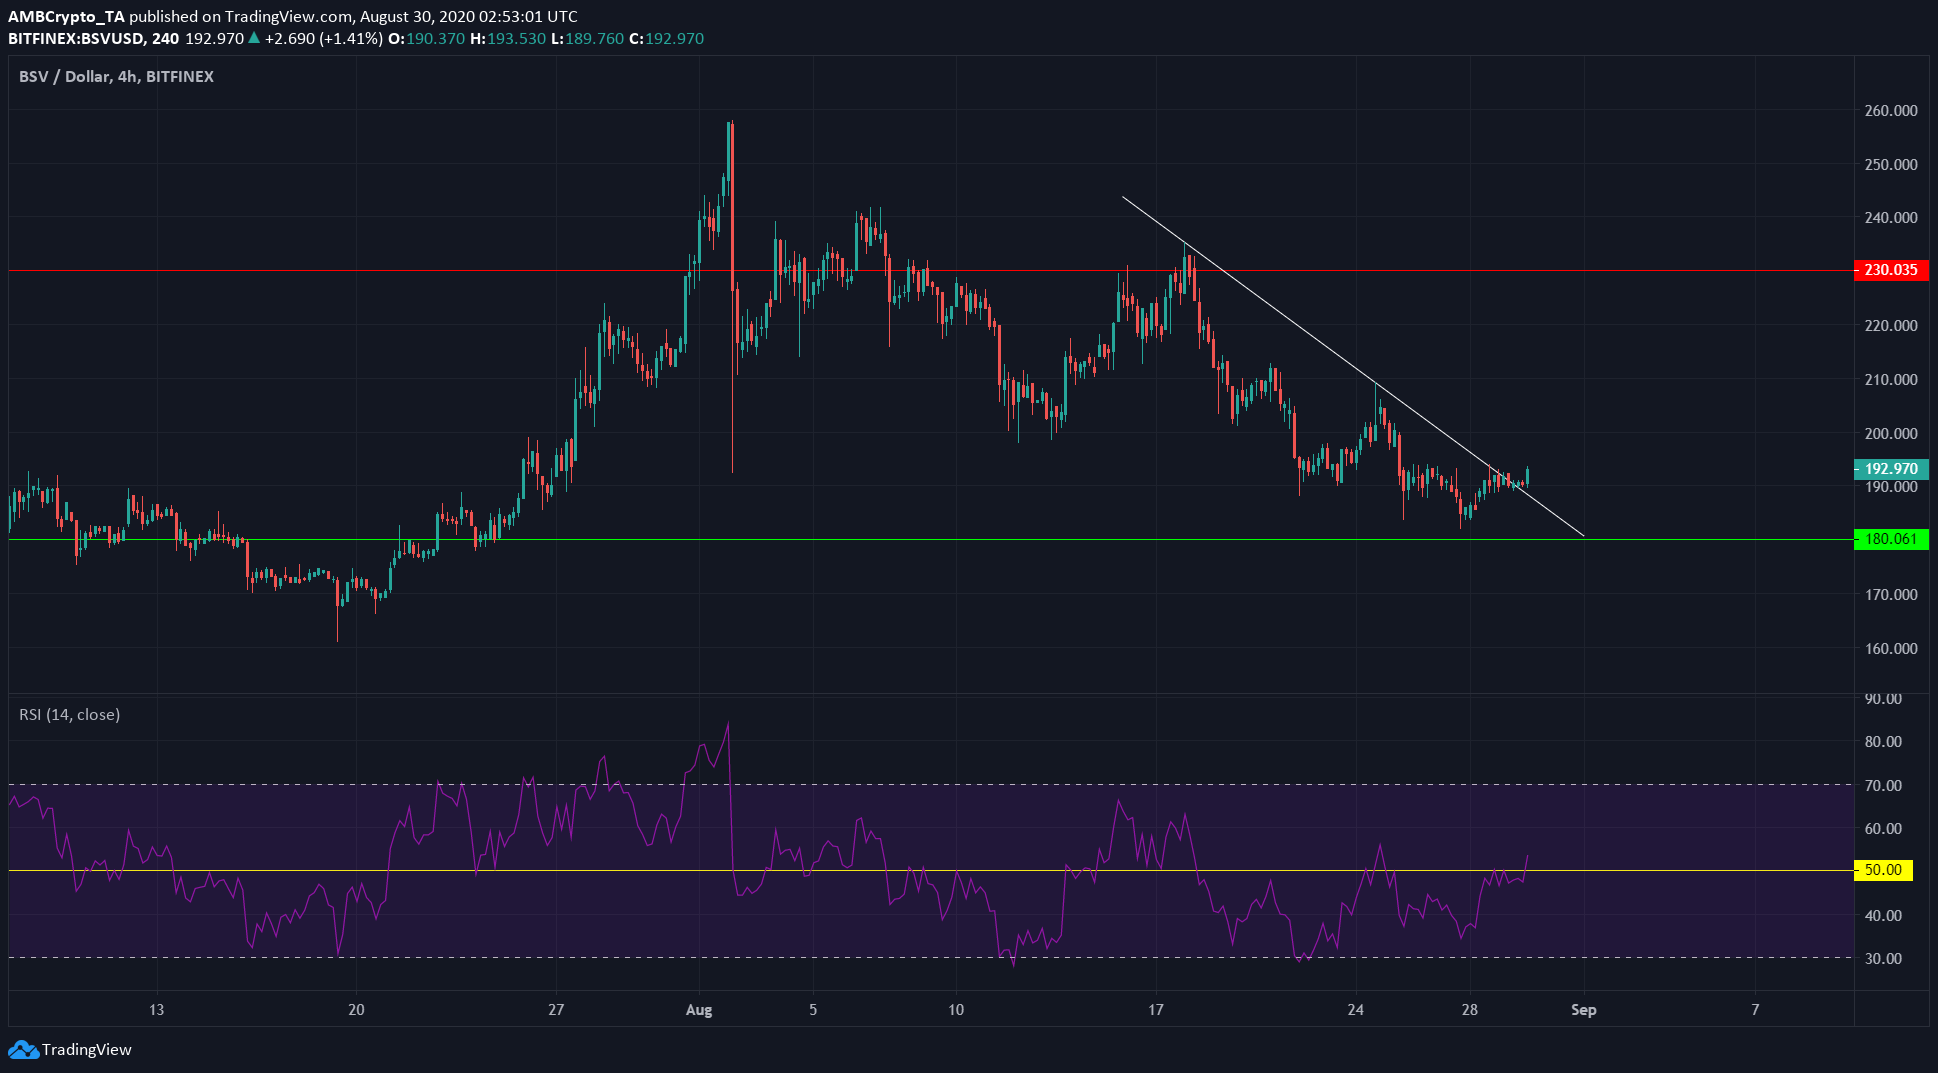
BSV showed it could have ended its downtrend as it stepped outside the trendline (white). This could lead to a period of consolidation, with zone of support at $180.
RSI showed a value of 53 and had been vacillating about the neutral 50 line for a few days.
It is also possible BSV is facing seller pressure and could lose support in the coming days, since BSV has been in a downtrend for the whole of August.
Steem [STEEM]

Source: STEEM/USDT on TradingView
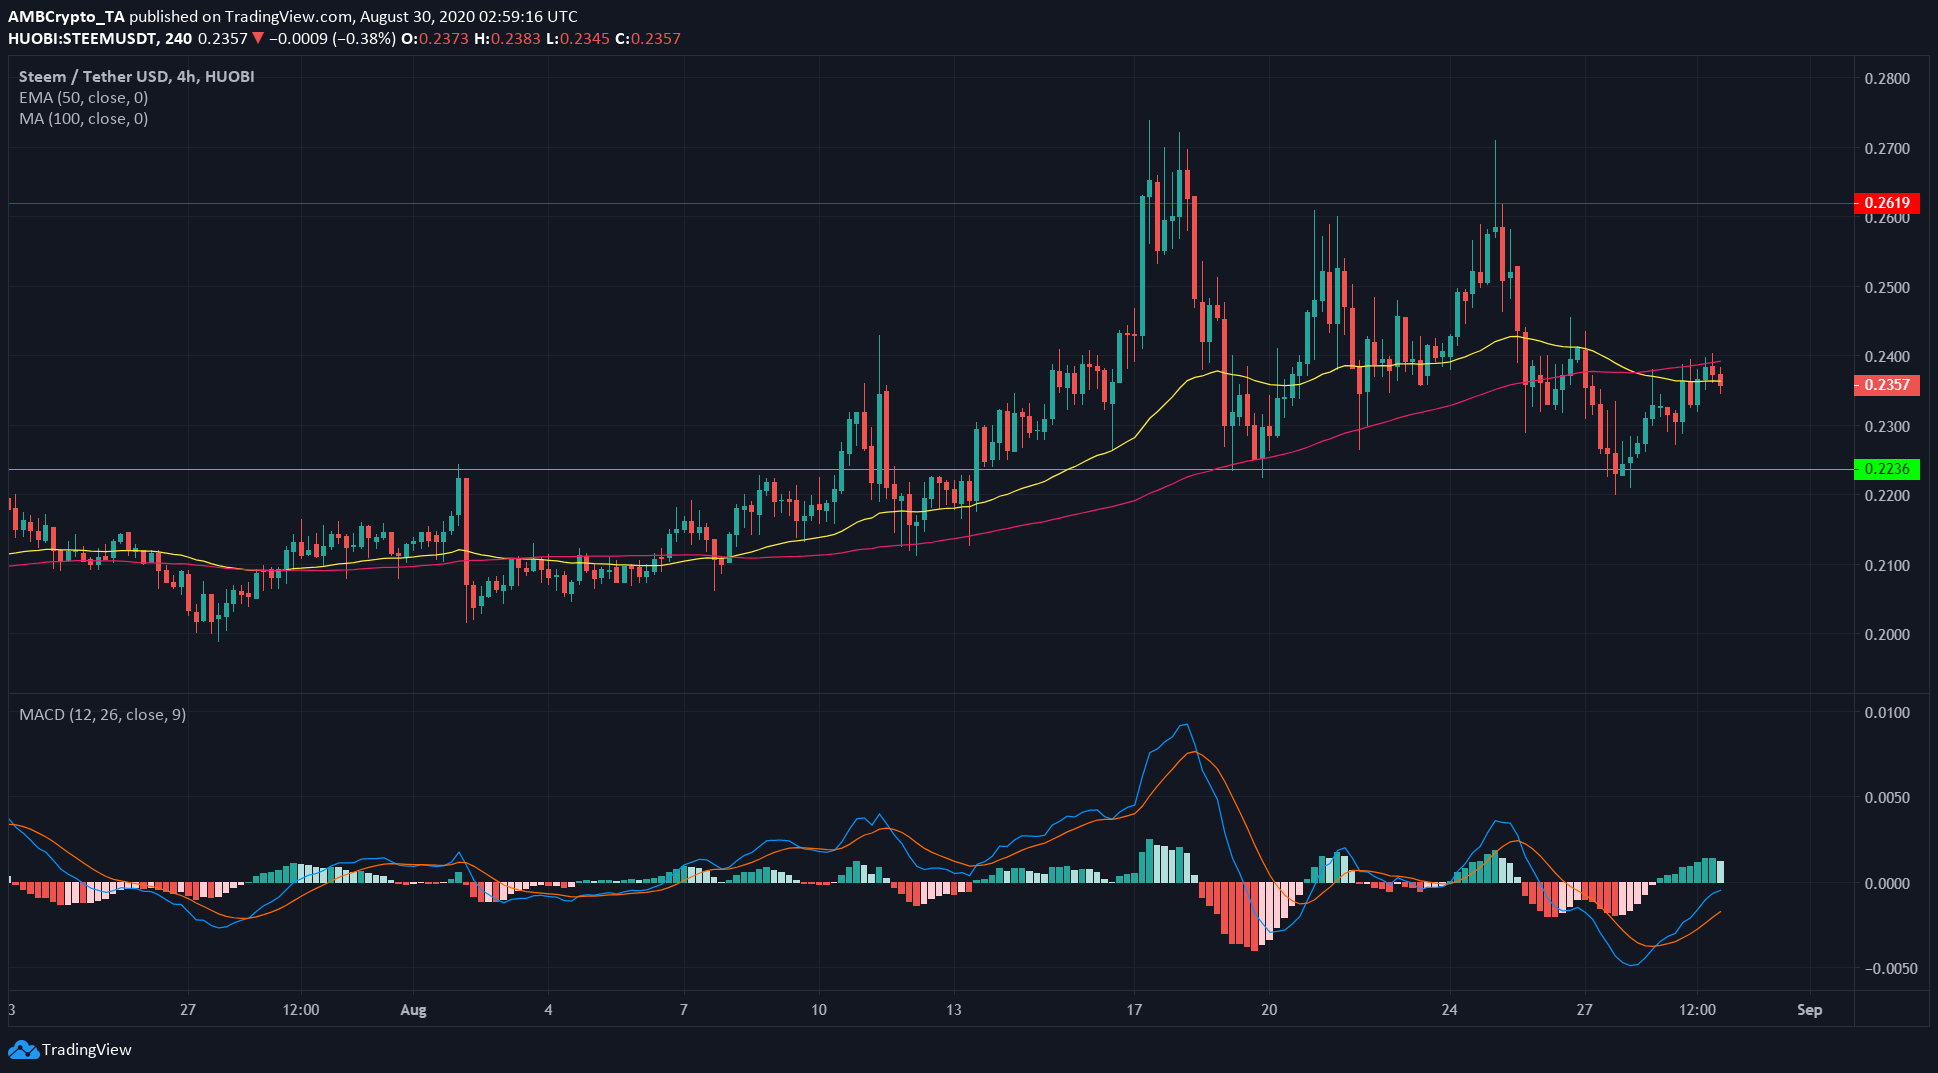
STEEM stepped out of a range from $0.2 to $0.22, to test level $0.27, and got rejected. STEEM revisited $0.22 support, but subsequent attempts to reach local highs were met with failure near $0.26 zone.
At press time, STEEM was trading at $0.2357. MACD showed a buy signal. However, 50 EMA (yellow) had crossed beneath 100 EMA (pink) to signal short-term bearishness.
Taken together, the best trading opportunites lie at the ends of the range, that is, at $0.22 and $0.26 levels


