
2019 was deemed as a positive year for virtual assets as a majority of the crypto experienced a positive hike; XRP surged in the market as well which took its valuation from $0.300 to $0.475, registering a growth of over 58 percent. However, recent bearish pullback impacted XRP’s price to take a dip below its yearly low of $0.283, which was last observed on 30th January 2019.
XRP was priced at $0.269 at press time while registering a devaluation of 4.32 percent in the last seven days.
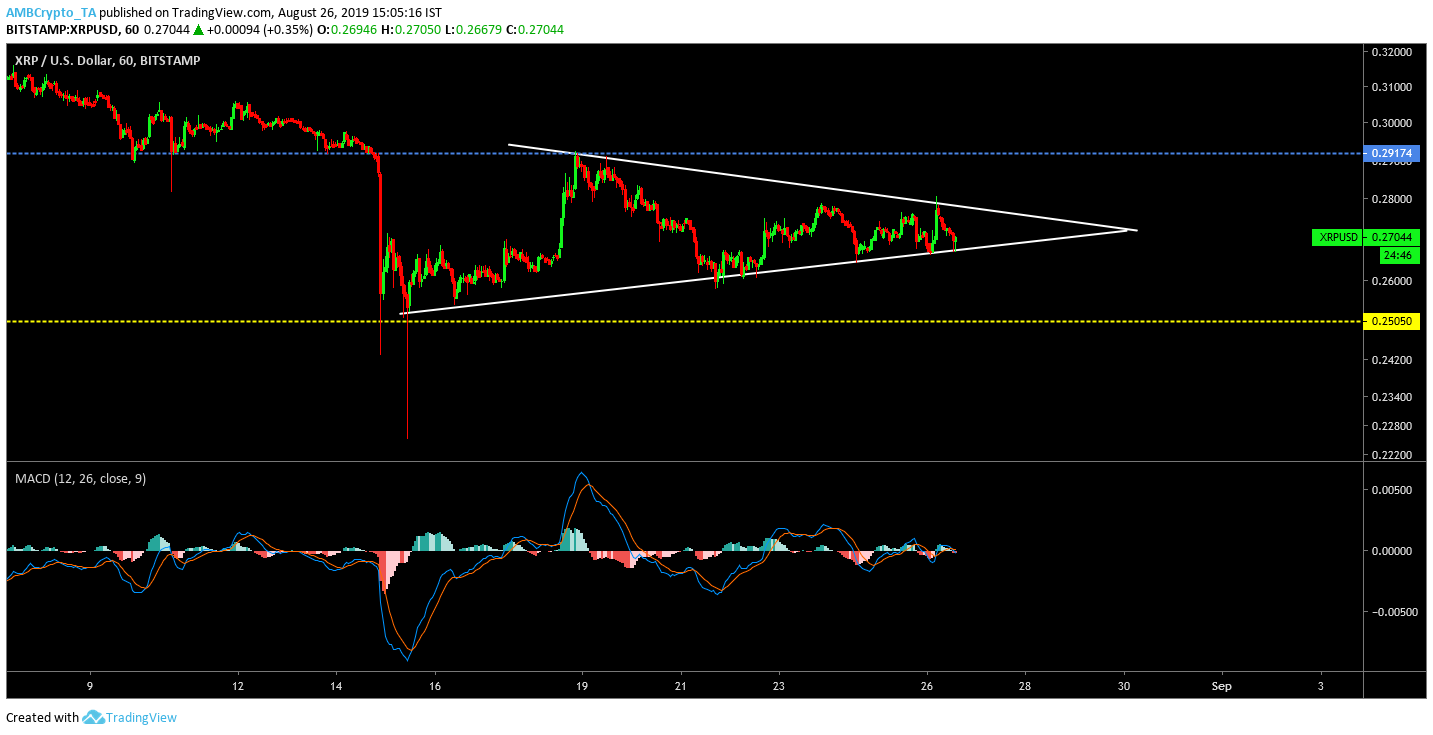
Source: Trading View
From the 1-hour chart, it can be observed that the price was consolidating above the support of $0.291 before the massive negative breakout transpired on 14th August. XRP’s valuation took a hit and slumped to $0.256, registering its yearly-low at that time. The price slumped down to $0.253 after that and since then consolidated towards minor recovery.
Price activity of XRP indicated the formation of a symmetrical triangle at press time which suggested that another price breach could unfold in the market. The breakout may take place on either side, as the price conformed to the pattern.
However, MACD line indicator trailed below signal line for XRP which increased the chances of an imminent bearish breakout once again.
XRP 1-day chart
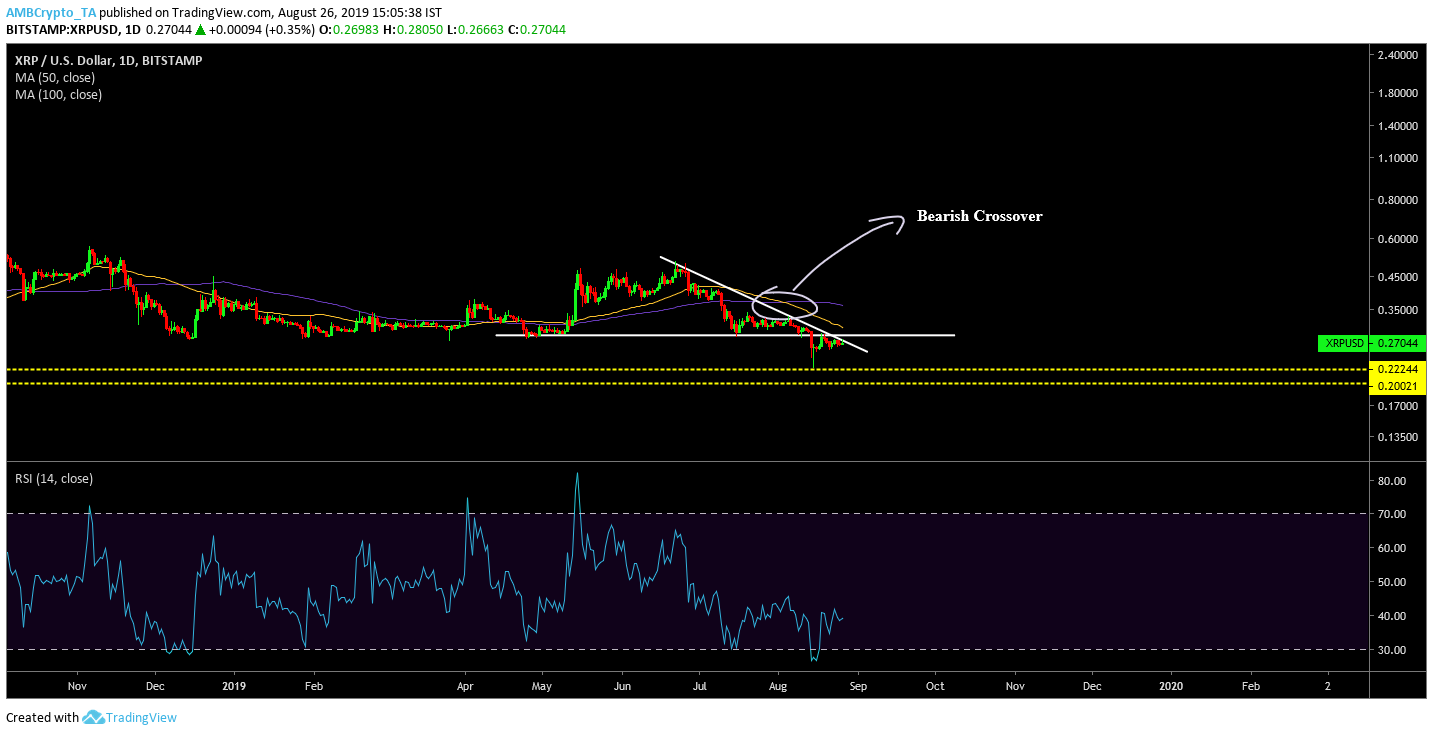
Source: Trading View
XRP’s loyalists may not be thrilled to look at XRP’s long term chart as the price activity underwent a breakout following the formation of a descending triangle. Price movement so far has confirmed the pattern formed; another bearish pull could take down XRP’s valuation to a new yearly low of $0.222.
Another key indicator that supported this hypothesis was the movement of 50-MA line. It was observed that the 100-MA line had completed a bearish crossover with the 50-MA which further validated and increased the chance of a bearish pullback. The Relative Strength Index or RSI line also navigated lower in the charts indicating traders’ exit from the market.
Conclusion
Most of the key indicators in the short-term and long-term charts of XRP signal another bearish breakout.