
Bitcoin, after breaking $7,000, mounting a YTD positive return, and reaching its highest price point in over three weeks, is looking relatively stable now. The price movement of the world’s largest cryptocurrency in the market has certainly been optimistic over the past few days; however, it bears little evidence of future movements.
In fact, as far as tracking Bitcoin’s historical and expected volatility goes, there is less room for movement in the near future.
According to data from Skew markets, the cryptocurrency has been less volatile in the past 10-days, than over the longer time scales. The BTCUSD realized or historical price volatility for Bitcoin suggested that the 10-day metric was 79 percent, lower than the 1-month, 3-month and 1-year metrics at 200 percent, 124 percent, and 89 percent, respectively.
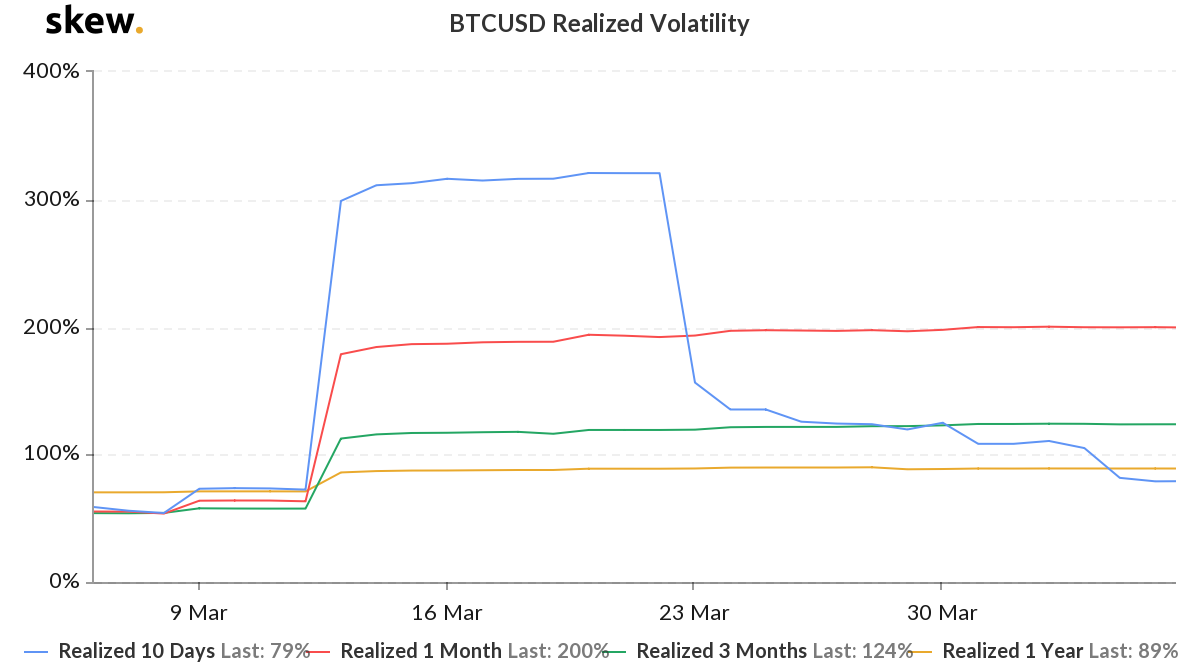
Bitcoin 10-days, 1-month, 3-months and 1-year Realized Volatility | Source: skew
It should be noted that the latest metric on Skew is from 5 April, prior to the $7,000 move, a development that contributed to an intra-day positive price change of 8.73 percent. Even if this is accounted for, the realized volatility [RV] will not move above its 1-month or 3-month equivalent.
Looking further into volatility and putting it in the perspective of imminent price action, a notable pattern can be seen. Bitcoin’s implied volatility [IV] or expected volatility, based on the pricing of the crypto’s Options’ contracts, has not only moved below its realized volatility, but widened the gap as well.
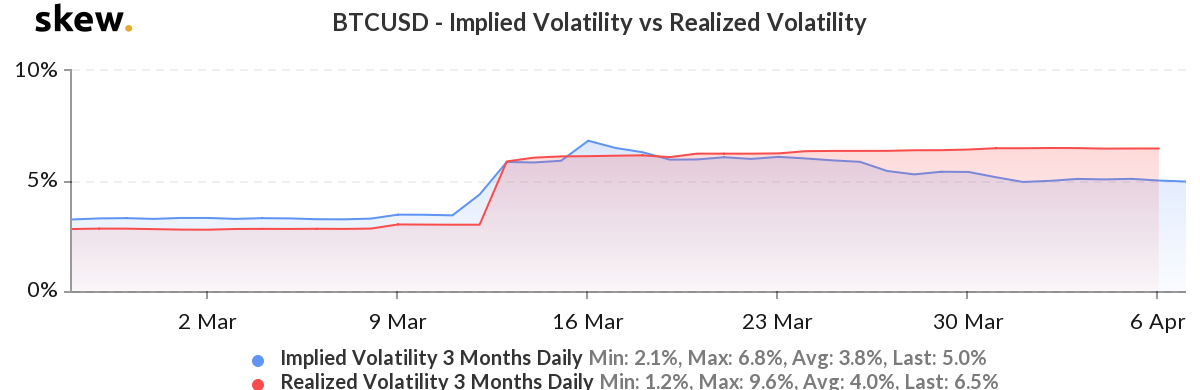
Bitcoin Implied Volatility versus Realized Volatility | Source: skew
The data from Skew markets suggests that the switchover happened on 18 March, and since then, the RV has been mounting over the IV. At press time, the realized volatility for Bitcoin on a 3-month daily scale was recorded to be 6.5 percent, with the implied volatility on a similar front at 5 percent.
On 16 March, based on the two volatility charts, the IV was 6.8 percent and the RV was 6.1 percent. This historic data suggested that Bitcoin’s price volatility in the next three months was expected to be more than the same over the previous three months. But, now, the stance has changed. As things stand, with the difference in the two volatility metrics, the price of Bitcoin is going [expected] to be less volatile than in the past [historic].
Unless a massive price move changes these metrics, the data suggests stable price movement, relative to what has already transpired.