Analysis
XRP may witness a breach of ascending triangle pushing its price upward
After being hauled through the bearish market for the most part of the year, XRP’s price has finally seen some growth. The third-largest coin fell by almost 17% in the month of August but has shown signs of recovery as a strong bullish momentum makes way to the market in short-term.
Current growth of the market noted a 1.62% growth in the past hour that pushed the coin’s price to $0.2543.
1-hour

Source: Trading view
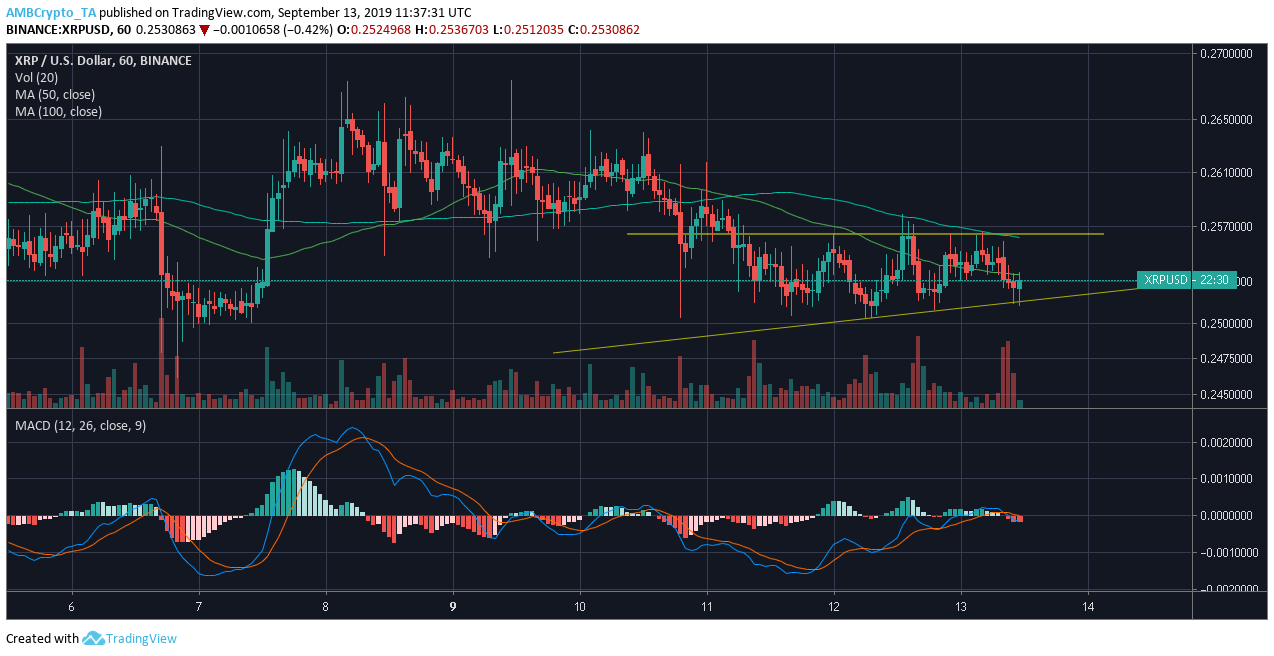
XRP’s 1-hour chart painted a bullish picture as formation of an ascending triangle is underway. Conceived as a bullish formation, ascending triangle is defined by a horizontal line that connects the swing highs at $0.2564, followed by a rising trend line marking the swing lows at $0.2505, $0.2509, and $0.2515. Volume of XRP also was observed rising over time, affirming a bullish breakout as the price further consolidates.
50 moving average was under the 100 moving average but noted returns of 0.53% within this period. However, growth in price could just be a recovery effort made by the struggling coin. MACD line rests under the signal line, 1-hour chart remained bearish.
4-hour
Source: Trading view
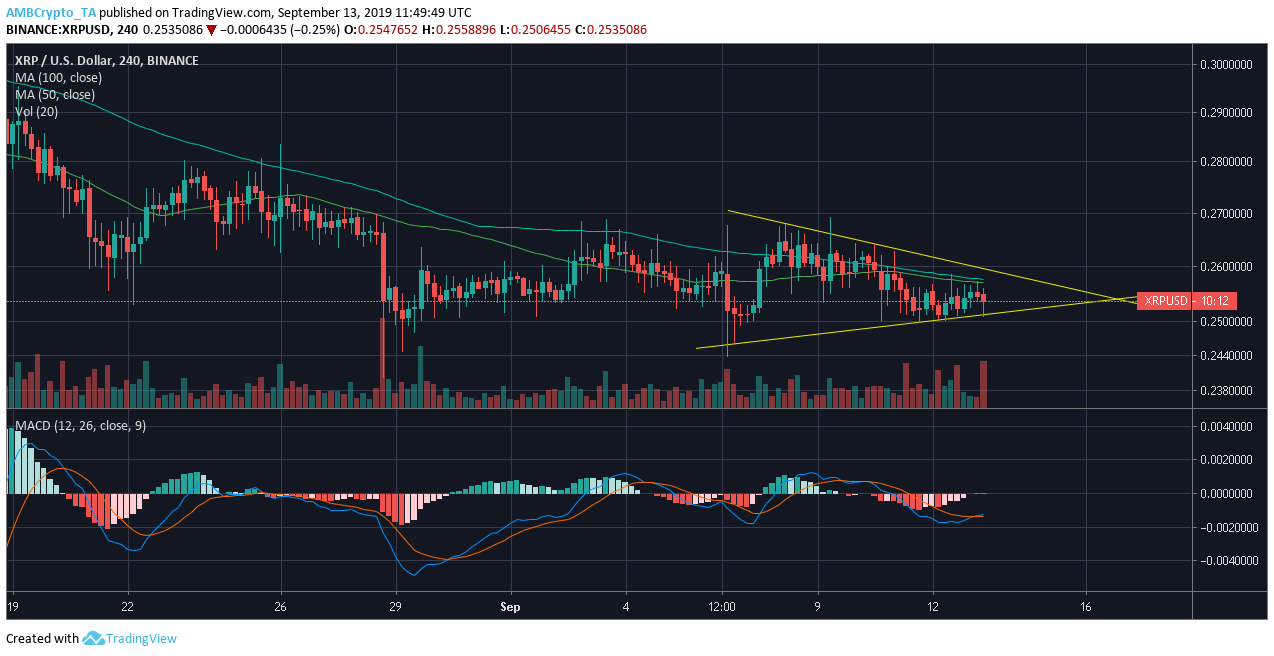
4-hour chart of the coin reported a formation of a symmetrical triangle characterized by two converging lines. Upper trend line bridged lower highs at $0.2681, $0.2643, and $0.2629, while lower trend line connected higher lows at $0.2461, $0.2502, and $0.2504. The pattern represented a consolidating price and may break upwards or downwards.
With 50 moving average under the 100 moving average for 35 days, the coin has noted a loss of 13.97% in valuation. However, MACD line is treading underneath the signal line and a crossover may be imminent, reversing the trend to a bullish one.
Conclusion:
With the price of XRP consolidating within the ascending triangle a bullish breakout may be imminent. Whereas, the symmetrical triangle might show a bullish leaning as MACD switches the current trend.


