XRP
XRP bulls breach symmetrical triangle as price follows an upward trend
XRP appreciated by 6.91% in the last 24-hours and was currently priced at $0.255. As it continued to hold the position as the third-largest coin by market cap on the crypto ladder, XRP posted better gains than top altcoins with a market cap of $11 billion and a 24-hour trading volume of $1.39 billion, at the time of writing.
XRP 4-hour chart:

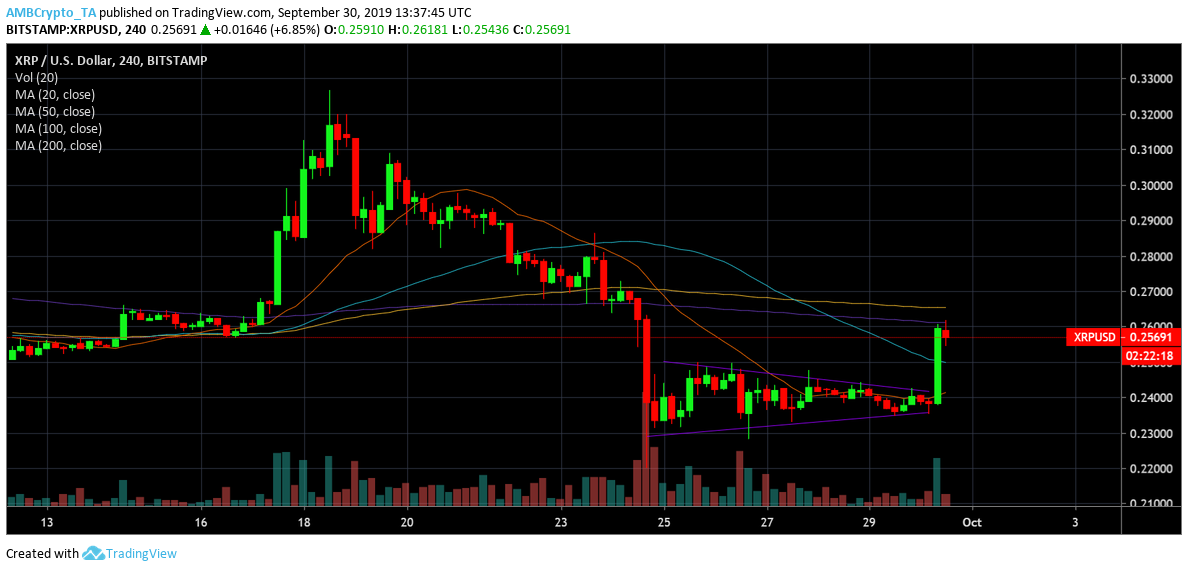
Source: TradingView
XRP underwent convergence and a subsequent phase of expansion following which the coin failed to retain its value and declined. The above short-term chart depicted formation of a symmetrical triangle pattern with price consolidating between two converging trendlines, one sloping upward and the other sloping downward.
XRP candlesticks broke out on the positive side and breached 50 moving average. The coin tried to surpass 200 moving average, despite suffering a rejection. 100 moving average acted as XRP’s immediate resistance at $0.26, which was above 200 moving average, while the support stood firm at $0.23.
Bullish sentiment on the rise
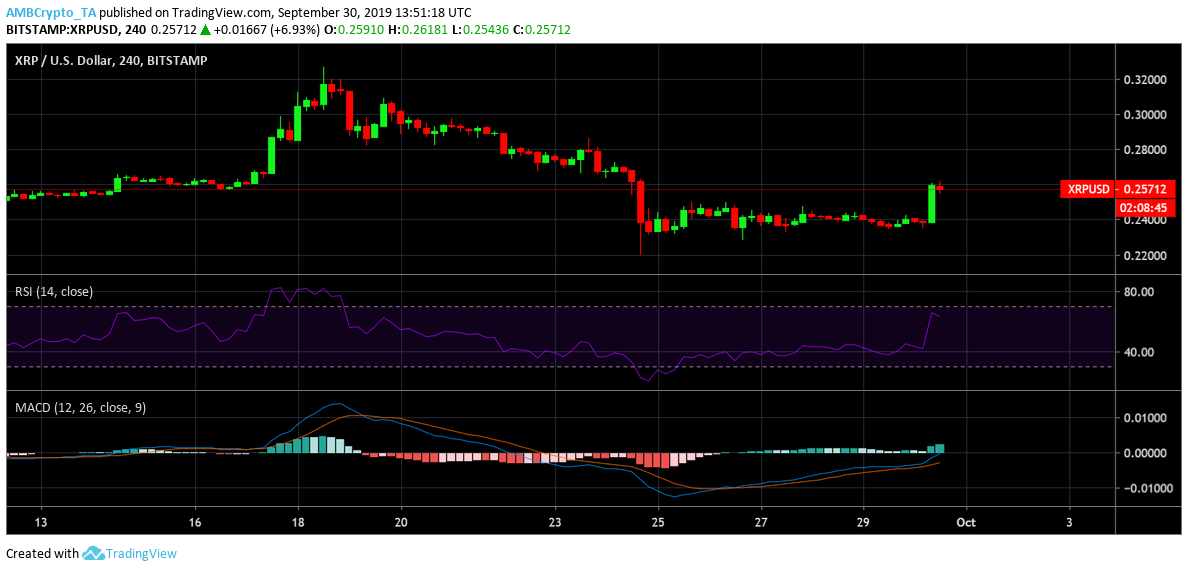
Source: TradingView
MACD indicator on the four-hour chart indicated a bullish pattern for XRP with signal line resting below MACD line. XRP sustained a bullish cross-over on 26th September and has been continuing since then. Additionally, RSI was well above the 50 median. RSI nearing the overbought zone was indicative of a high bullish sentiment among buyers.
Conclusion:
The above short-term chart suggested a bullish phase for the coin with high buying sentiment among buyers and strong support.


