Disclaimer: The findings of the following article are the sole opinions of the writer and should not be taken as investment advice
Litecoin registered a decline of 8% on the back of a broader market sell-off. The altcoin’s price broke below the strong support level of $140 and was about to test the 19 May swing low of $116, at the time of writing. While reactionary buying could alleviate some of LTC’s recent losses, the threat of a sharper decline loomed large over the coming week.
Litecoin Daily Chart
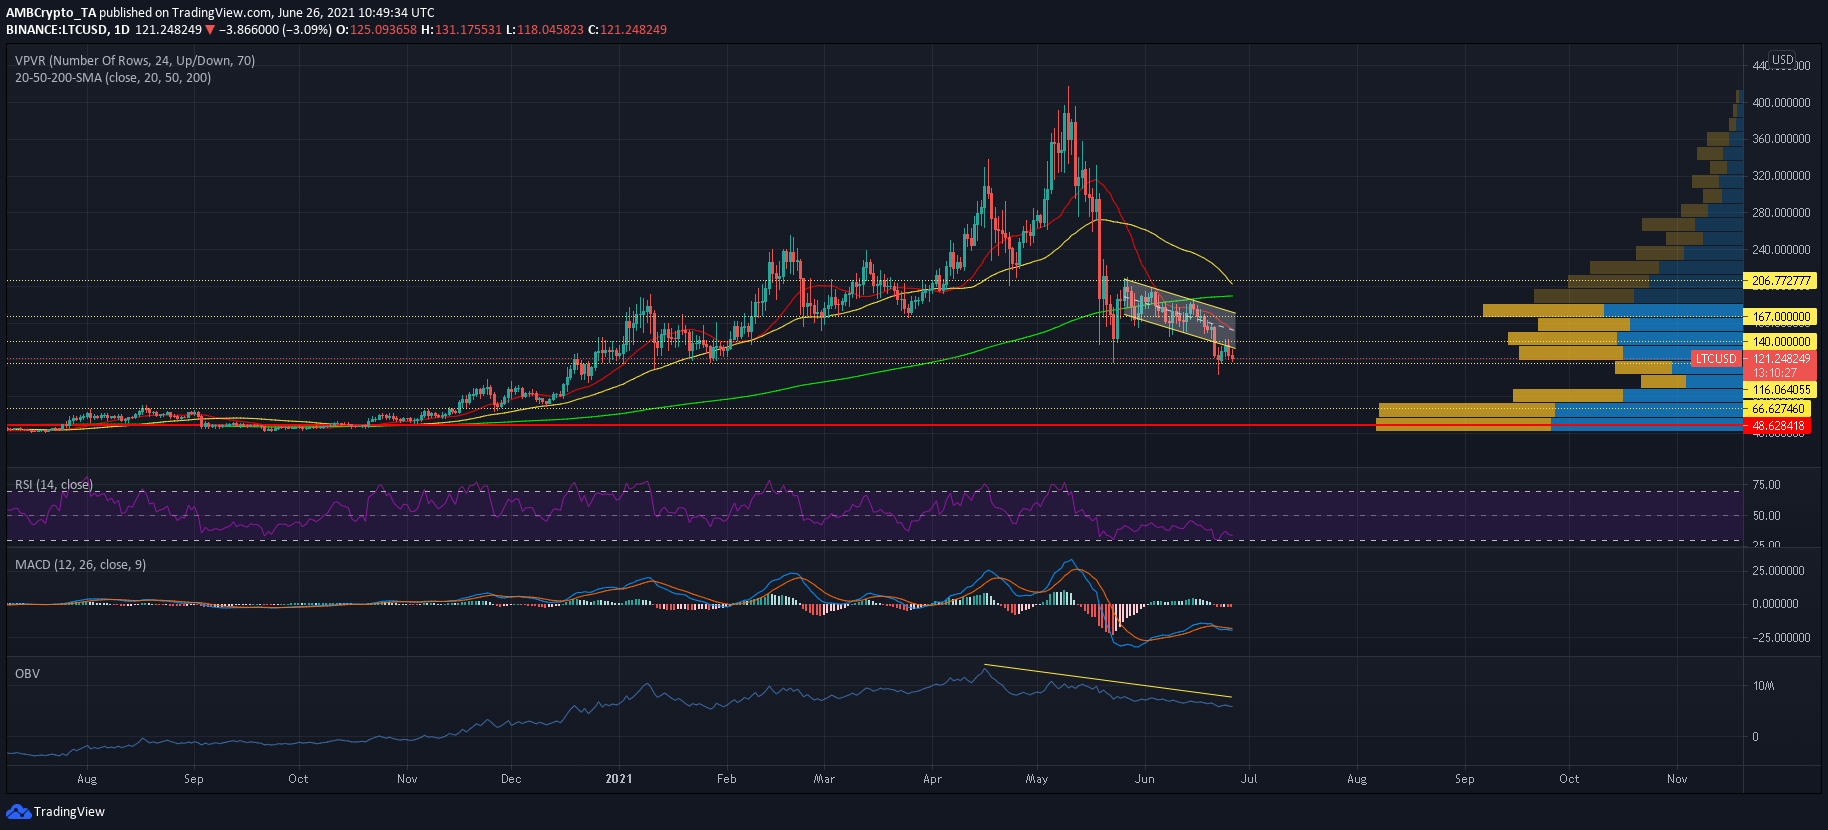
Source: LTC/USD, TradingView
A descending channel breakdown saw LTC register losses of 22% as the alt’s price moved towards the demand zone between $116-$140. In fact, LTC has largely oscillated between these two points since 21 June as buyers have been able to match up to the selling pressure. However, the candlesticks were below their 20, 50, and 200 SMAs and without their support, LTC is always vulnerable to an extended downtrend.
Reasoning
The OBV has declined steadily since 17 April, even during times when LTC was snapping fresher local highs. This divergence hinted at a pullback even prior to the wider crypto sell-off. The index continued its southbound descent at press time as selling volume outmatched buying volume.
Weakness was also evident on the Relative Strength Index since it has failed to move above 50 for over a month now. A move into the oversold zone does warrant a reversal, one that could push LTC back towards its 20-SMA (red) and $156 over the coming days, but gains would be short-lived in a market that is largely dominated by sellers.
While the MACD did attempt to recover above equilibrium, momentum fizzled out as sellers regained control.
Furthermore, a death cross can be seen approaching as the 50-SMA inched closer to the 200-SMA, and bearish sentiment would likely accentuate losses. A close below its 22 June swing low of $104 could trigger a steady downfall of 40% towards its late-December levels of $66. Interestingly, the Visible Range’s point on control also lay around this mark.
Conclusion
Litecoin’s demand zone of $116-$140 could trigger a minor comeback in the market, but bears would dictate its movement over the coming week. A close below the 22 June swing low of $104 could open the door for another 40% drawdown to levels last seen in December 2020.