Analysis

Binance Coin: This pattern might be key to a near-term rally
Posted:
| Last updated: September 15th, 2021

Disclaimer: The findings of the following analysis are the sole opinions of the writer and should not be taken as investment advice
The last few weeks have been rocky for the world’s largest cryptocurrency exchange by volume – Binance. The platform has been under regulatory scrutiny from watchdogs in countries such as U.K and Japan, while also facing investigations in U.S. and Germany. While Binance battles through a period of uncertainty, its native cryptocurrency’s price seems to be unfazed by these latest revelations.
In fact, BNB formed a symmetrical triangle over the past few days and presented chances of an upwards breakout moving forward. At the time of writing, BNB was trading at $294.8, up by 3.8% over the last 24 hours.
Binance Coin 4-hour chart
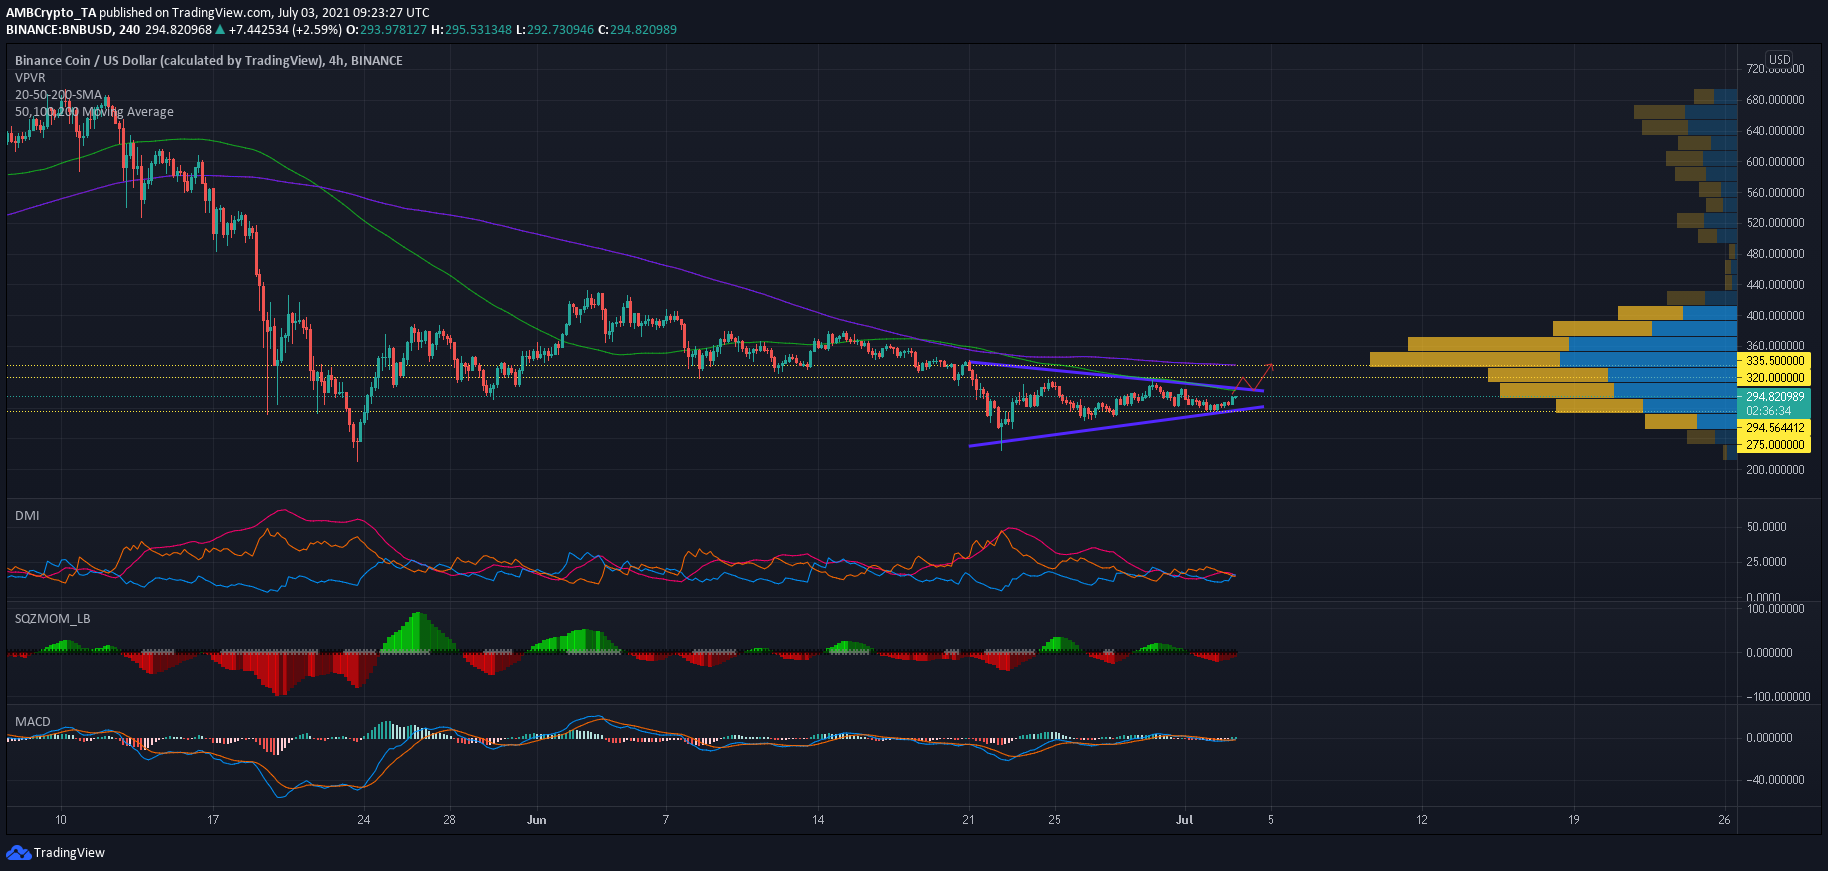
Source: BNB/USD, TradingView
BNB’s retracement on 21 July and its movement thereafter led to the formation of a symmetrical triangle – A pattern that sees a breakout in either direction. While the preceding trend prior to the formation of this pattern was bearish, there were indications of a trend shift in the market. The upper trendline clashed with the 4-hour 100-MA (blue) and a close above $300-305 could trigger an upwards breakout.
Reasoning
The Directional Movement Index noted a bullish crossover between the +DI and -DI as buyers prepared to overturn market control. The Squeeze Momentum Indicator noted receding bearish momentum and the first green bar followed by a white dot would represent the onset of a price swing.
Interestingly, the MACD line had already crossed above the Signal line and its histogram suggested that some northbound pressure had already seeped into the price.
The aforementioned factors indicated that chances of an upwards breakout were higher, as opposed to a downtrend. Such an outcome could result in a 15% rally towards the resistance zone of $320-$335.5. This area has been noting a high level of interest, according to the Visible Range, and could trigger a minor correction before the next upswing.
Traders can make the most of this movement by setting up a long trade but a safer bet would be to wait for BNB to pierce above its 100-MA before taking a position.
Levels to watch out for
Entry: $303
Take-profit: $335.5
Stop-loss: $275
Risk/Reward: 1.16x
Conclusion
BNB’s projected breakout from its symmetrical triangle presented long opportunities for traders. An entry was set just above BNB’s 100-MA and at $303, while a take profit was set at the higher range of its resistance zone – An area that also clashed with the 200-SMA.