Litecoin short-term Price Analysis: 15 October

As mentioned in a previous article, Litecoin’s price has followed through with a bullish breakout. This changed the previously ambiguous situation into a bullish one. A deeper look into Litecoin’s price movement and indicators will reveal what the bulls/bears have in store for LTC.
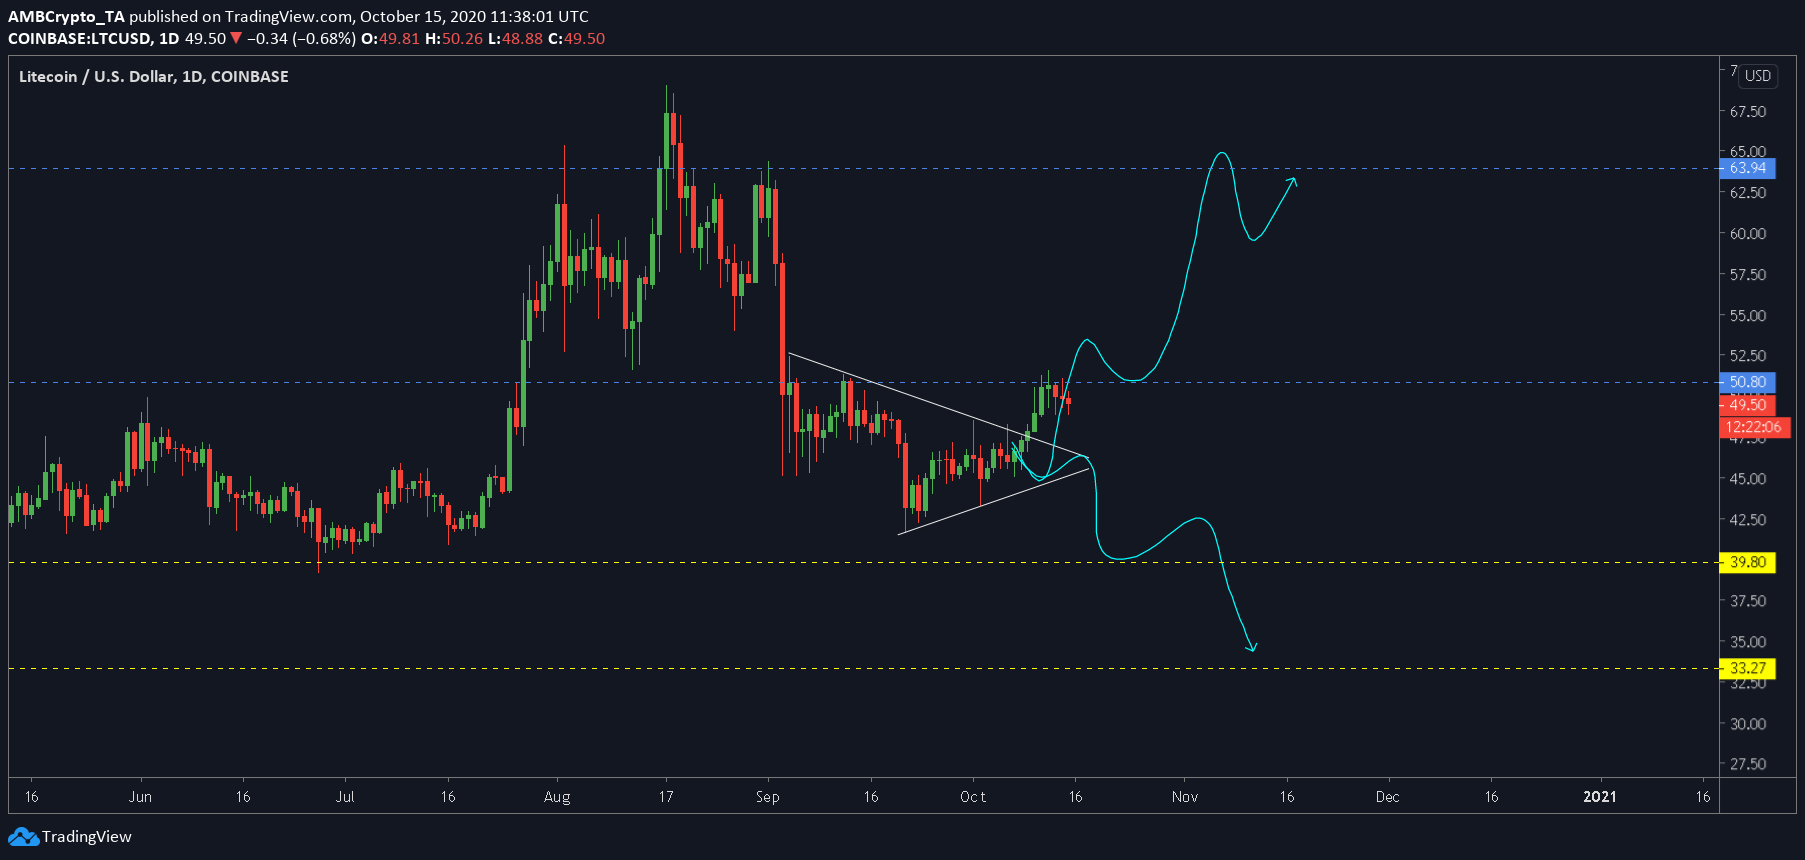
Litecoin 1-day chart

Source: LTCUSD on TradingView
The one-day chart for Litecoin showed the cryptocurrency breaking out of the triangle. However, it seemed to be facing rejection at the resistance level of $50.80. Should the LTC bulls fail to conquer this level, it’s back to the pavilion.
The RSI indicator presented a potential reversal before the overbought zone, hence, if need be, bulls have the space to push the coin above the said resistance. The Stochastic RSI pictured a bearish crossover, a sign of bearish pressure. However, this can be disregarded if the bulls push through.
Levels to keep an eye out for remain the same from the last article – The immediate resistance of $63.94 is a good resting place in case the price surges and reconquers the $50.80-mark.
However, a bullish scenario is hard to come by, especially considering the bearish divergence on a daily time frame. This might push the price down to the top of the consolidation triangle, a level where the price will find more support.
Since this divergence is on a higher level, this might take place over a couple of days. Hence, going into shorter time frames would give more insight as to where the price might head in the short-term.
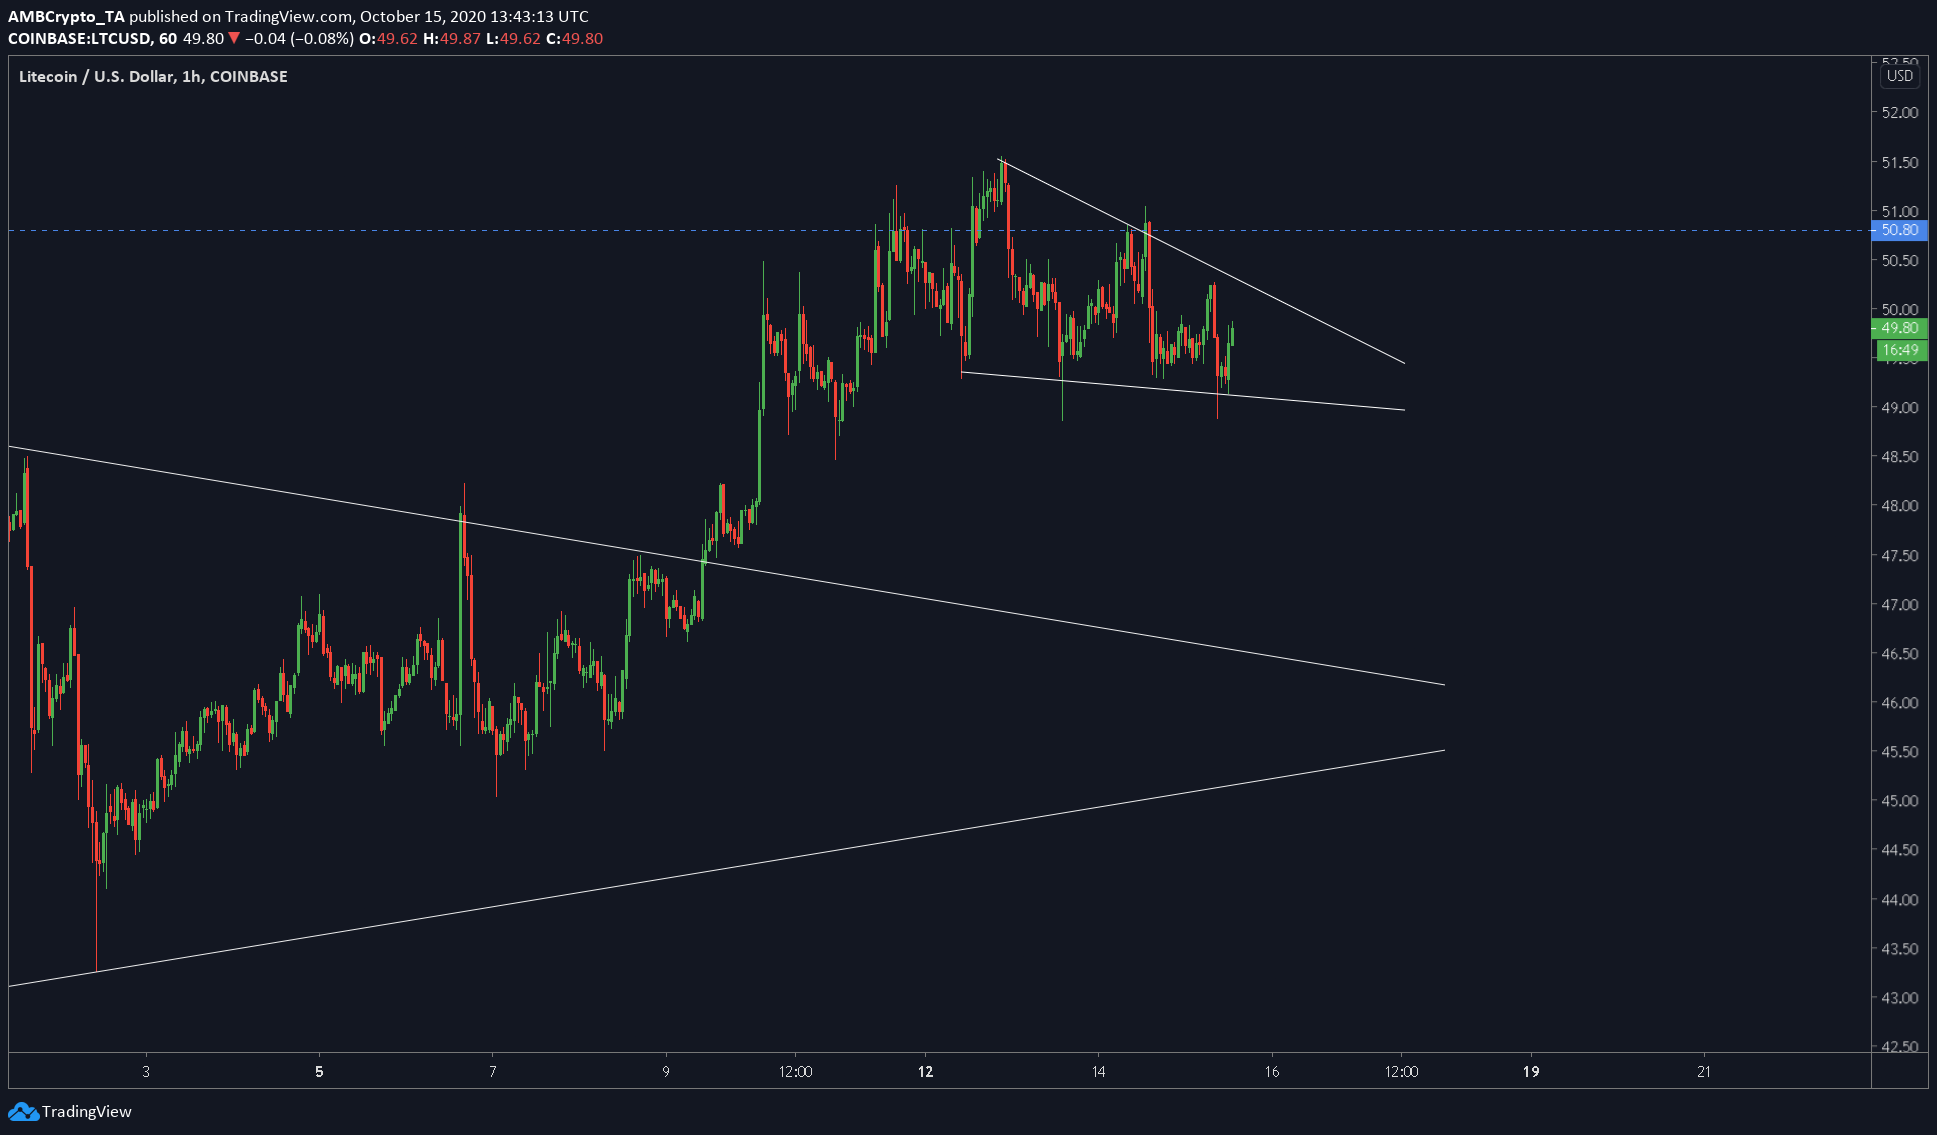
Litecoin 1-hour chart

Source: LTCUSD on TradingView
The one-hour chart does go against the above bearish indication, but it should be noted that they are two different time frames. On a much shorter timeframe, we can expect Litecoin to head higher since a falling wedge was being formed.
While the price still has a few bounces left before the breakout, we can expect the price to retest the $50.80-level before heading lower. There is a high chance that this might just be a wick.
Conclusion
Either way, the long-term [1-day] looked bearish, in light of the rejection at $50.80 and a bearish divergence. However, the short-term [1-hour] scenario seemed bullish due to the formation of a falling wedge.
It is better to sit this trade out on both timeframes as the tides could turn either way, especially considering Bitcoin’s uncertain price.


