Litecoin, like many altcoins in the market, has seen its price drop on the charts. At press time, a consolidation after the aforementioned drop seemed to be ongoing, following which, LTC may be due for a small pump. Overall, Litecoin’s price was observed to be up for a small pump, one that could turn bullish if it breaks the larger consolidation pattern.
Litecoin 1-day chart
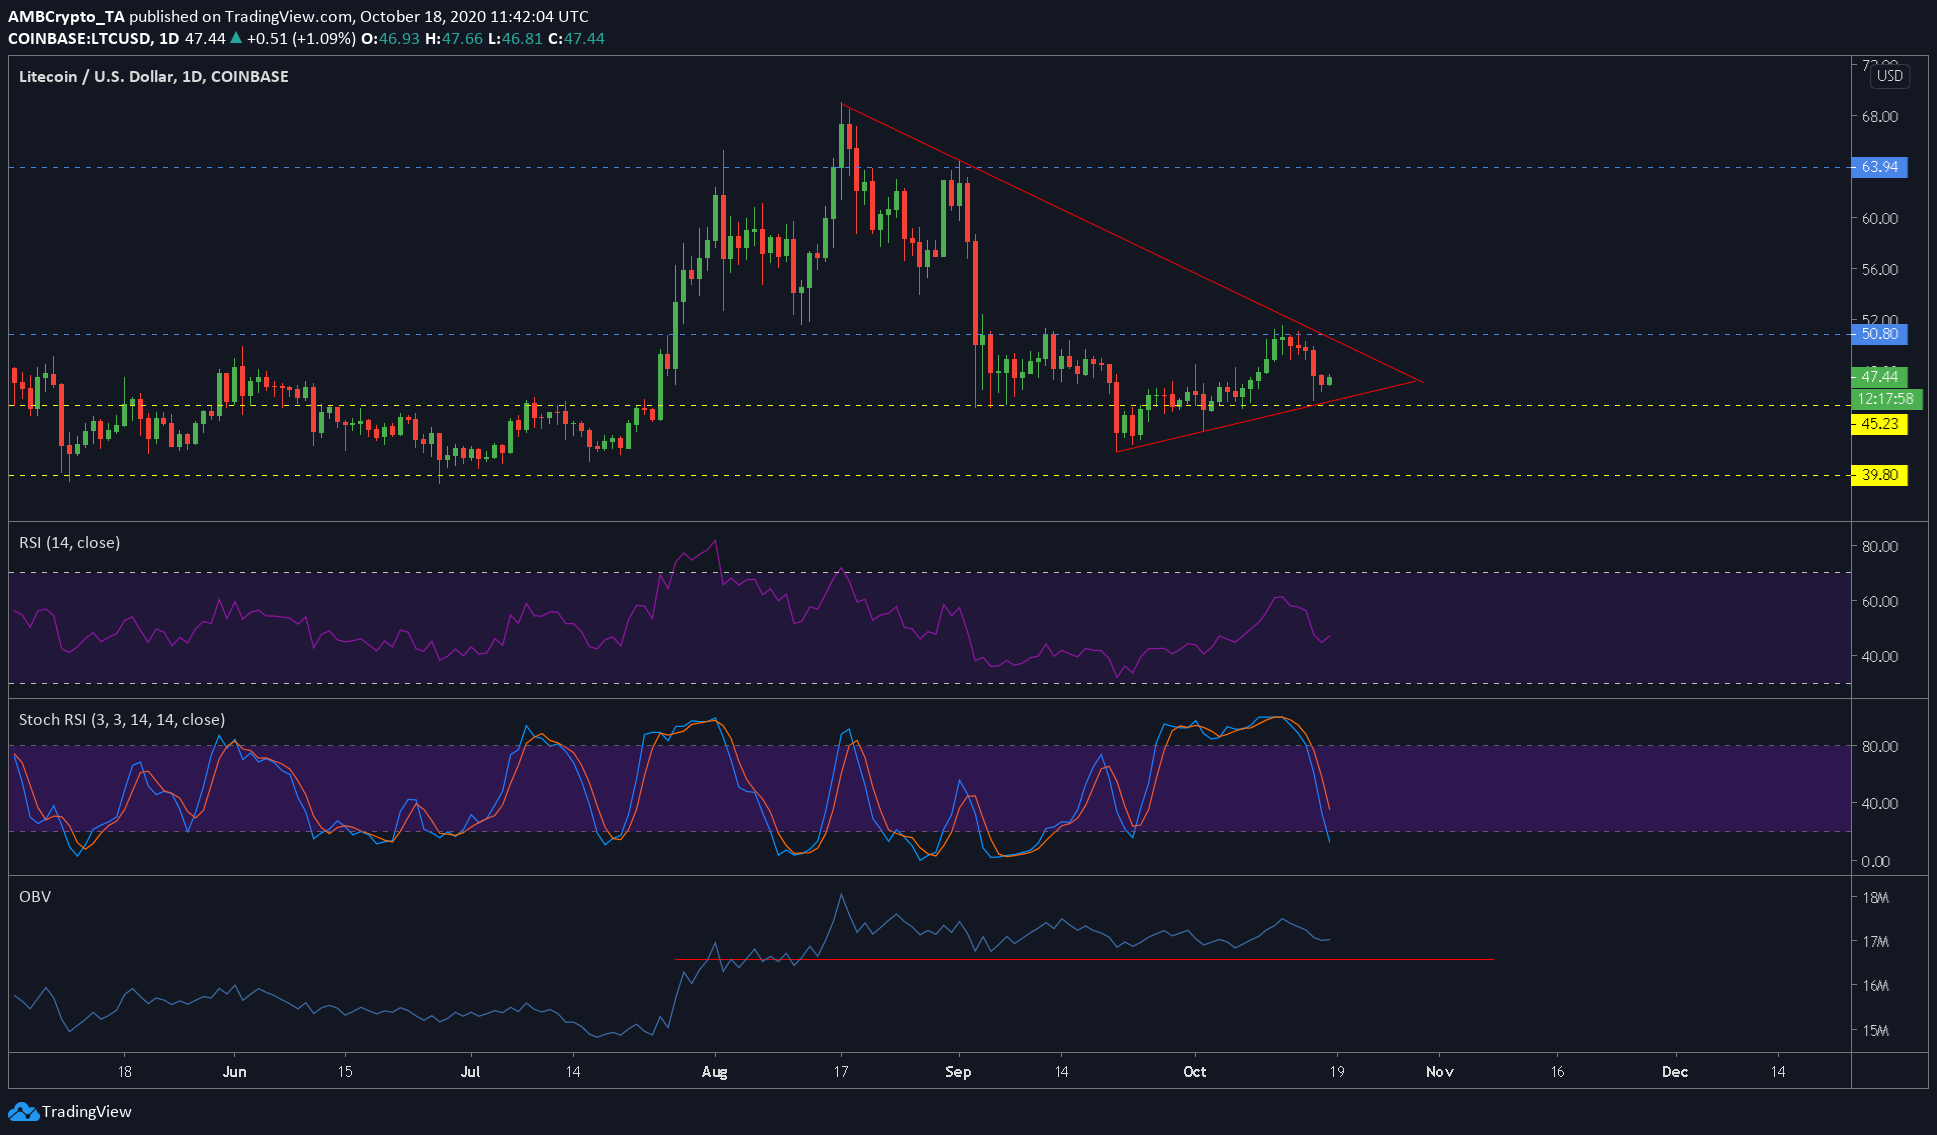
Source: LTCUSD on TradingView
Litecoin’s one-day chart noted a consolidation pattern in the form of a symmetrical triangle. A pump that began on 21 September had pushed LTC’s value by 24% from $41.57 to $51.55. However, following the same, a bearish divergence contributed to the price dropping by 7.55% to where it stood at the time of writing.
The immediate levels of support for LTC included $45.23 and $39.80, while the immediate resistance levels included $50.80 and $63.94. However, there could be an intermediate resistance between the aforementioned resistance levels and LTC can test each of them, before continuing higher.
As of now, the LTC set-up looks bullish in the short term, however, if the price does manage to successfully break above the consolidation pattern, it could be bullish in the long-term.
The RSI pointed to a short-term rebound close to the 50-level [aka neutral zone], one that could be related to the short-term bounce mentioned above.
The Stochastic RSI indicator showed a sharp decline from the overbought zone and towards the oversold zone. A bullish crossover is still a long way from happening, however, it could be a possible sight a few days down the line.
The OBV indicator seemed to hold consistently at $16.5 million or higher, a figure that indicated that no new volume had come into trading. This might imply a false appreciation in price.
What to expect?
A surge of 7% or higher can be seen in the coming week, however, any surge above the consolidation of $50.77 would be bullish. A bounce lower than this level would be bearish for the coin.
Since the RSI and the Stochastic RSI were bullish and the volume indicator noted uniform volume, a surge can be expected up to $50.77. Any surge above this level would be a fake surge.