Analysis

Binance Coin, Polkadot, MATIC Price Analysis: 21 May
Posted:
| Last updated: July 5th, 2021
Binance Coin needed to retake the key 50% Fibonacci level ($445.5) to assert bullish control. Polkadot could stabilize at the $27.8-support level before moving north, but bearish cues could result in a drop back towards $25. Finally, MATIC could dip to $1.50 before bouncing back above $2.
Binance Coin [BNB]
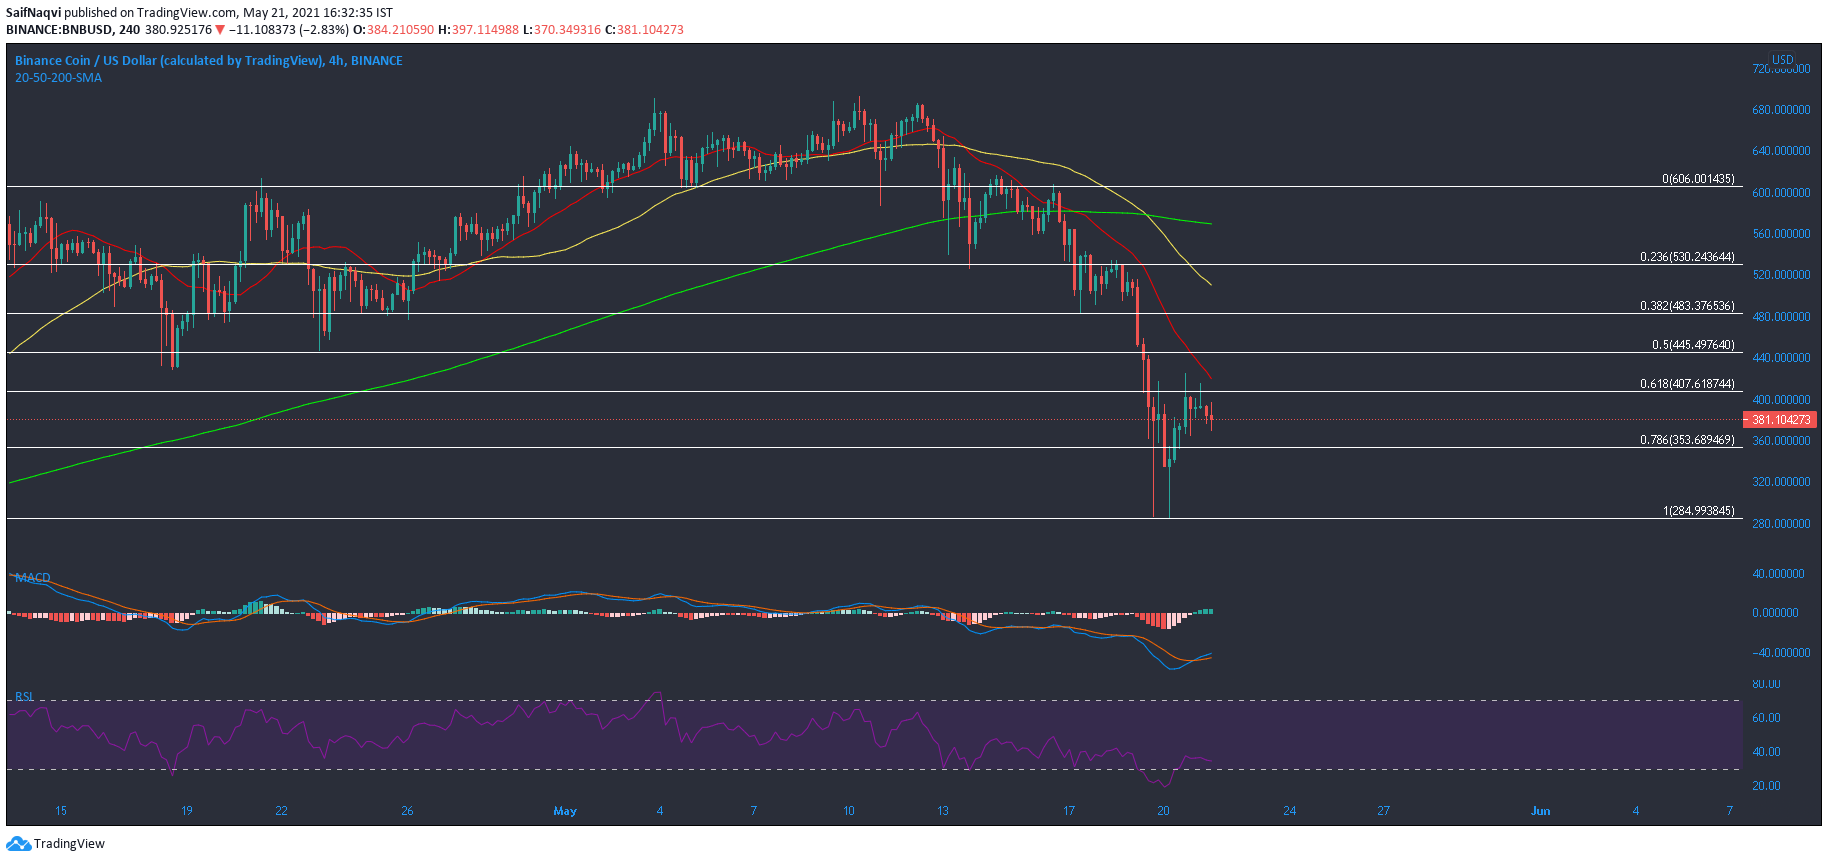
Source: BNB/USD on TradingView
Binance Coin’s recovery was in progress after it reclaimed the 78.6% Fibonacci level ($353.7), but a critical area lay at the 50% Fibonacci level ($445.5). This key area has countered multiple pullback attempts since, forming a reliable defensive zone in the process. If BNB manages to reclaim this buy zone, expect it to sustain itself above $445.5 in case of short-term pullbacks. Before such an outcome, the bulls first have to target a hike above the $40.7.6-resistance and the 20-SMA (red).
A bullish crossover in the MACD was a step in the right direction and a hike above half-line would be followed by strong bullish sentiment. On the other hand, the RSI was yet to recover from the bearish territory.
Polkadot [DOT]

Source: DOT/USD, TradingView
Like most large-cap alts, Polkadot’s movement was also tied strongly to broader market cues. After falling to a low of $19, rapid buying saw DOT make a comeback towards $30 as bull sellers reemerged once again after Bitcoin lost ground on $41k. At press time, DOT hovered just above its $27.8-support and stabilizing at the press time price point could lead to a push above $32.8 and the 20-SMA (red).
The Stochastic RSI traded in neutral 50 while the Squeeze Momentum Indicator noted weakening bearish momentum. Regaining the range between $32.9-$38.5 would be an important bullish development – One that would flip bearish conditions in the market. Conversely, a weaker broader market could push DOT back towards $25.
MATIC

Source: MATIC/USD, TradingView
MATIC was one of the few alts in the market that traded above its 200-SMA (green), despite the broader market dump. In fact, it was one of the first few alts to initiate a recovery even before Bitcoin crossed $41k. While MATIC did rise above $2 from its $1.6-support during a rapid buy period yesterday, the 20-SMA (red) formed a stubborn resistance and selling pressure returned.
At the time of writing, MATIC threatened to move below its 50-SMA (yellow) on the 4-hour chart. Bearish sentiment could even drag the cryptocurrency towards $1.5. On the plus side, traders could mop up MATIC at this discounted price level and look to go long. The MACD line was in danger of falling below half-mark.
With HODLers accumulating MATIC even through the price drop, a strong case can be made for a hike above $2 post the dip. The Stochastic RSI was oversold at the said level and a price reversal can be expected over the coming hours.