
Bitcoin has many rivals. But the one it really wants to displace is gold.
Gold has been an investing ‘safe-haven’ for centuries, but digital gold is challenging its claim. The cryptocurrency claims to have more real-world transact-able value than gold. And what’s more, it can be easily stored, sent across the globe, and used as currency. The one thing it doesn’t have against its tangible counterpart is stability.
One of the hardest to inherit qualities of safe-haven assets is, well, ‘safety.’ Is Bitcoin very safe? Well, if you look at a mere price chart of Bitcoin, the 2020 low of $3,800 and the 2020 high of $22,000 would prove otherwise. Compare this to gold, which saw a low of $1,480 and a high of $2,050. This high low approach between the $9 trillion market of gold and the $194 billion market of Bitcoin does not represent the actual difference between the volatility of the two assets.
Broadly speaking, for the first 9 months of the year, looking at daily price changes, these are how the two assets fared. It should be noted that the data looks at daily price, not hourly, hence Bitcoin’s 12 March drop to $3,800 is corrected by its rise to $5,500 before the end of the day, and the crypto markets are 24*7, hence Bitcoin had a total of 276 trading days while gold just had 198.
| Categories | Gold | Bitcoin |
| Min price | $ 1,480.53 | $ 5,059.15 |
| Max price | $ 2,052.02 | $ 12,113.15 |
| Average price | $ 1,540.58 | $ 9,186.42 |
| Days above average | 189 | 153 |
| Days below average | 8 | 123 |
| Total days | 198 | 276 |
| Max Deviation price | $64.83 | $1,522.70 |
| Max Deviation % | 4.1% | 25.0% |
| Max Deviation date | 24-Mar-20 | 12-Mar-20 |
| Average Deviation price | $ 11.92 | $ 151.41 |
| Average Deviation % | 0.7% | 1.8% |
| Deviation over 1% | 46 | 137 |
| Deviation over 2.5% | 6 | 53 |
| Deviation over 3% | 3 | 41 |
| Deviation over 5% | 0 | 18 |
| Deviation over 10% | 0 | 4 |
What immediately catches the eye, is the deviation in the last 5 rows. Bitcoin deviated more than 5 percent for 18 days of the year, while gold saw no such days. Similarly, Bitcoin deviated more than 10 percent, for 4 days in the year while gold saw, once again, 0 such days. In fact, Bitcoin saw a maximum deviation of 25 percent, while gold’s highest was 4.1 percent!
Another point that stands out is the average deviation in dollar terms for the two assets. Gold’s average deviation was $11.9, or roughly 0.63 percent of its current price of $1,905, while Bitcoin’s was $151.1, which is 1.4 percent of its current price of $10,600.
Now, this graph below does sound alarm bells. You can almost hear Peter Schiff saying, ‘I told you that Bitcoin was a bunch of nonsense, see how volatile it is! And look at gold, staying stable, like a gold safe-haven asset should!’
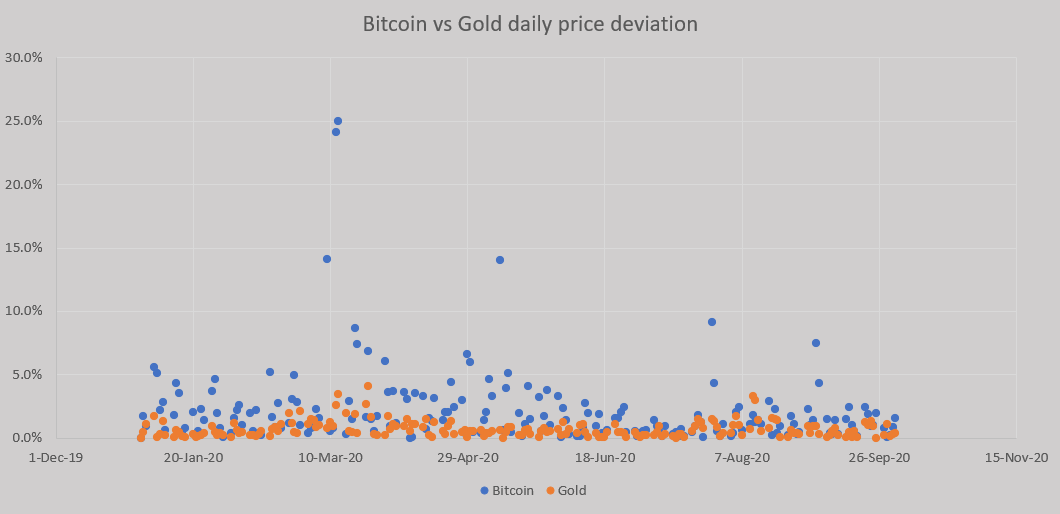
While this graph at first does point to a massive difference between Bitcoin’s price movement and gold’s with the ridiculous number of blue dots over 5 percent, (18 to be exact) and not a single orange one, one would think that Bitcoin is as rapid as a roller coaster, while gold is as calm as a park bench. The data, at face value, does suggest a massive lack of stability for Bitcoin as against gold, but it only tells half the story.
For 49.6 percent of the days in the year, Bitcoin saw a deviation of over 1 percent, while the rest or 50.4 percent of the year saw a deviation of less than 1 percent. Compared this with gold, which saw a deviation of more than 1 percent for 23.2 percent of the year and less than 1 percent for 76.7 percent. In fact, Bitcoin’s average daily deviation for the year was 1.8 percent, compared to gold’s 0.7 percent, noting a difference of just 110 basis points in volatility between the two assets!
What’s more, is the range of deviation. While the price deviation over a point was massively higher for Bitcoin and negligible for gold (on the higher deviations), the ranged deviation saw the two assets move closer.
Unsurprisingly, the most volatile period for the two assets was in the second and third weeks of March. For gold, between March 12 to March 24, the average daily volatility was 2 percent, which doesn’t seem like a lot, but for an asset which moved on average by 0.7 percent for the entire year, trust me, it’s a lot! Compare this to Bitcoin, which saw an average daily volatility of 10.1 percent in the same period, against an average of 1.8 percent throughout the year. It should be noted that gold’s highest volatility is x5.8 its average, while Bitcoin’s is x13.9, suggesting that Bitcoin’s average volatility is more skewed by its extremes compared to gold.
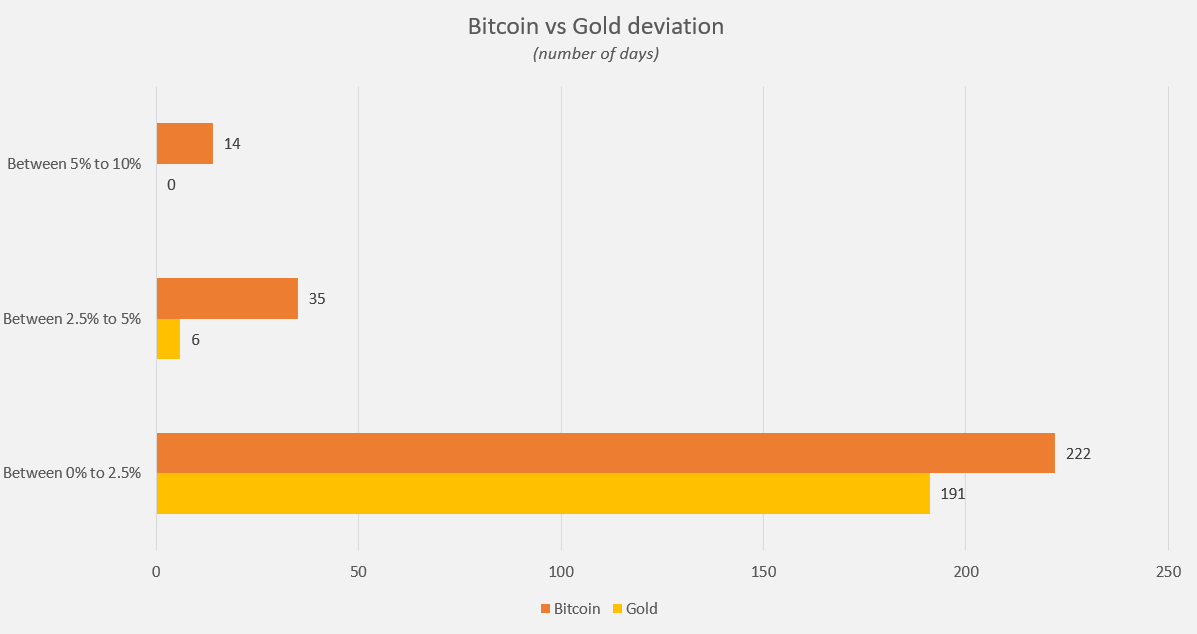
Price deviation between 0 percent to 2.5 percent, showed that gold saw 191 days within this range and Bitcoin saw 222 days within this range. This means that for all the trading days of 2020 gold and Bitcoin were trading with a volatility of between 0 percent to 2.5 percent for 96.5 percent and 80.4 percent respectively. Bitcoin did have more days with less volatility than gold i.e. 222 for BTC compared to 191 for gold, but since the cryptocurrency’s market never closes, the 222 days accounted for 80.4 percent of all its days. Further, Bitcoin just had 35 days or 12.7 percent of its year, with volatility over 2.5 percent and under 5 percent, while gold had 6 days or 3 percent of its year!
Again, the price charts on their own can be deceiving. While Bitcoin has had a larger price deviation owing largely to the March drop (with two of its highest swings on 12 and 13 March respectively), its stability has improved since. This price recovery was also not a mere ‘pump but was a gradual upward movement from April to May, and July to August.
Volatility is not a static concept, that should be seen by highs and lows, or by the maximum and the minimum deviation, it should be seen as a range-bound movement, which clearly points to Bitcoin holding its own against gold. The cryptocurrency which is traded more frequently, in unorganized markets and even in countries where it is banned is showing only marginally less deviation than gold. While gold, which is standing firm in a collapsing equity market, is also deviating by a fractional but noticeable amount every day.
Bitcoin is not massively volatile compared to gold when trading with some momentum behind it. However, because of the ‘pump and dump’ nature of the cryptocurrency markets, Bitcoin has seen more extreme movements than gold, both on the ups and the downs.