Tezos, Stellar Lumens, DigiByte Price Analysis: 29 September

With the world’s largest altcoin Ethereum priced above $350, at press time, major cryptocurrencies now appeared to be less conflicted with their price recovery.
At the same time, Tezos and Stellar Lumens continued to improve from their weekend valuations, as a bullish market momentum resurfaced for the two altcoins.
DigiByte, however, had witnessed a dip in price levels by almost 7.5% since yesterday.
Tezos [XTZ]

Source: XTZ/USD on TradingView
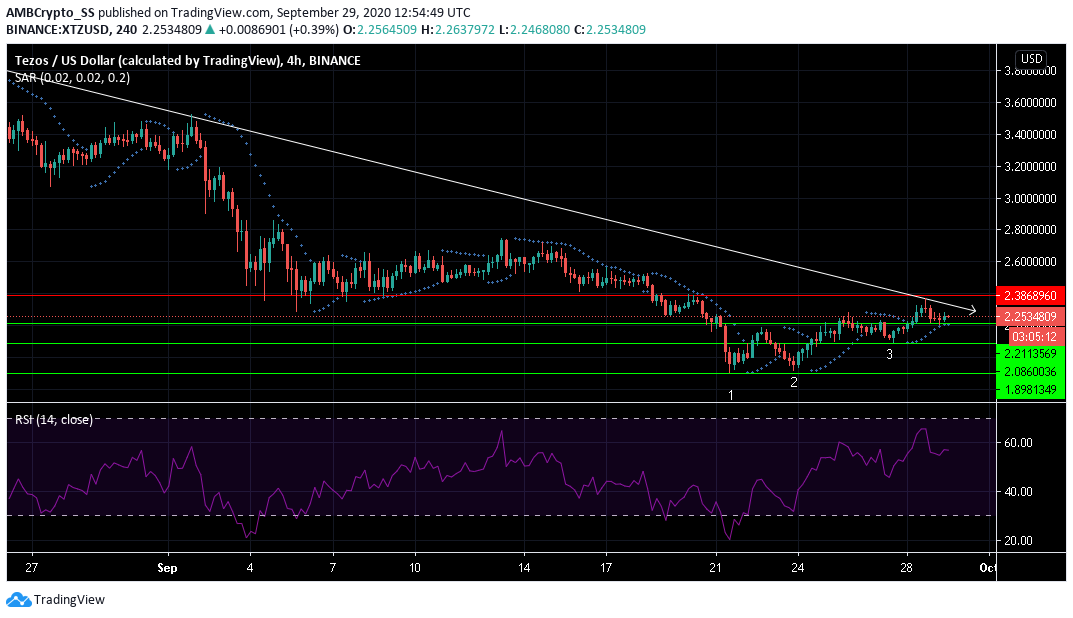
After a persistent downward price trend, since mid-September, which tanked Tezo’s price by almost 30%, the digital asset started rising again from its support level of $1.898.
Strong buying momentum, pushed its price above three key support levels, in the last one week. The digital asset at the time of writing was trading at $2.253.
Towards, the end of the declining trend on 21 September, Tezos witnessed the formation of a bullish pattern of 3 rising valleys as marked in the chart. This was an indication that buyers were overtaking sellers, which ultimately pushed the prices higher.
The Relative Strength Index (RSI) had been on the rise since the last few days and was still above the neutral 50 zone , confirming the presence of a buying sentiment in the short term period.
Further, the dotted lines of the Parabolic SAR, below the candles, suggested bulls could push the prices above the immediate support level of $ 2.211, as the scenario continued to be bullish.
Stellar Lumens [XLM]

Source: XLM/USD on TradingView
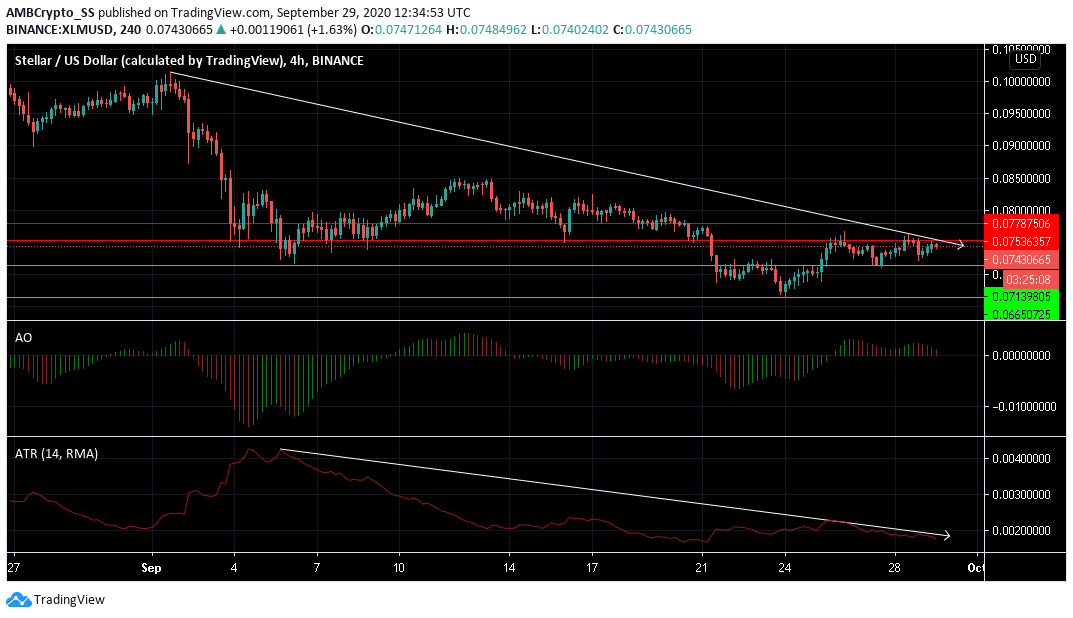
Stellar Lumens, the native cryptocurrency of the Stellar network, was at press time trading at $ 0.074. The price movement during the last few days was constricted between the support and resistance levels of $0.071 and $0.075 respectively.
Awesome oscillator displayed a bearish twin peaks setups above the zero line, with the second peak being lower and closing in red bars.
Average True Range (ATR) a technical indicator that measures the market volatility was showing a consistent dip since 6 September and was indicating a low level of market volatility.
With the announcements from Tezos Foundations earlier in the year towards a fresh ecosystem grant for 21 new projects, a potential bullish price correction is expected as the projects roll out towards the beginning of the fourth quarter.
DigiByte [DGB]

Source: DGB/USD on TradingView
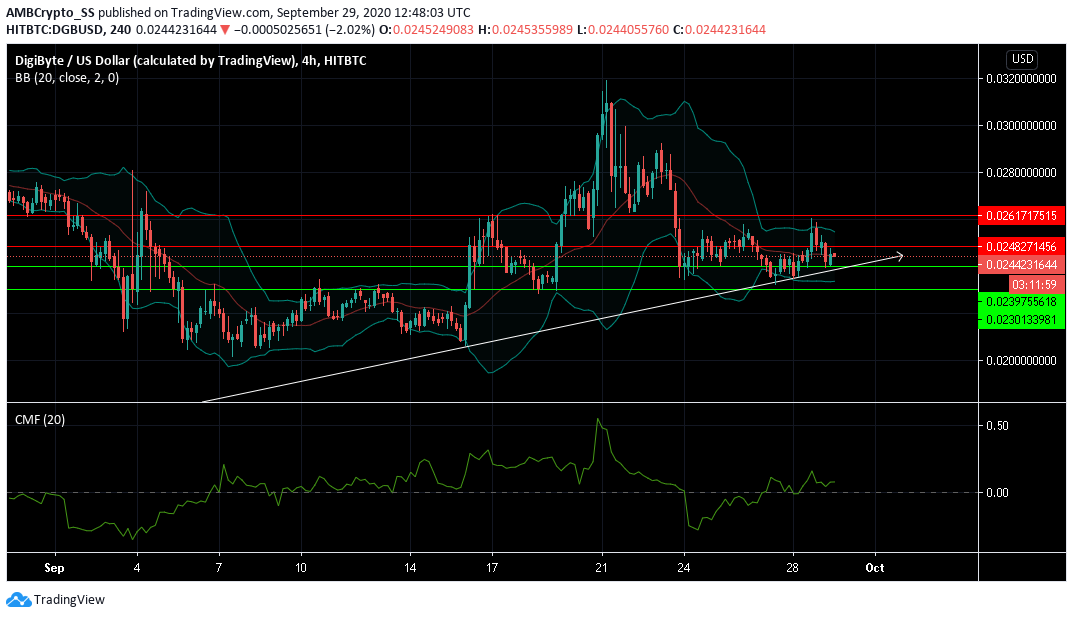
DigiByte at the time of writing was trading at $ 0.024. Earlier in the day, the digital asset was seen moving above its immediate support level of $ 0.023.
However, the narrowing down of the Bollinger bands indicated reduced volatility levels, while the price trend continued to consolidate along the median bands.
Despite being in an overall uptrend, a breach of the $ 0.024 resistance level in such a scenario, could potentially also take a much slower path.
Although the asset wasn’t able to breach the immediate resistance level, Chaikin Money Flow , above the zero level, indicated the degree of capital in-flows was still higher than capital outflows for DigiByte, with the possibility of another positive rally still around the corner.


