Tezos long-term Price Analysis: 13 November

Tezos, once a major altcoin threatening a position in the top 10, has been unable to take advantage of the recent bullish scenario. While the coin has dropped down to 18th in the market, its long-term charts failed to indicate a lot of positive momentum. While its recent Delphi upgrade reduced smart contract gas fees by 75%, its impact on the price was minimal.
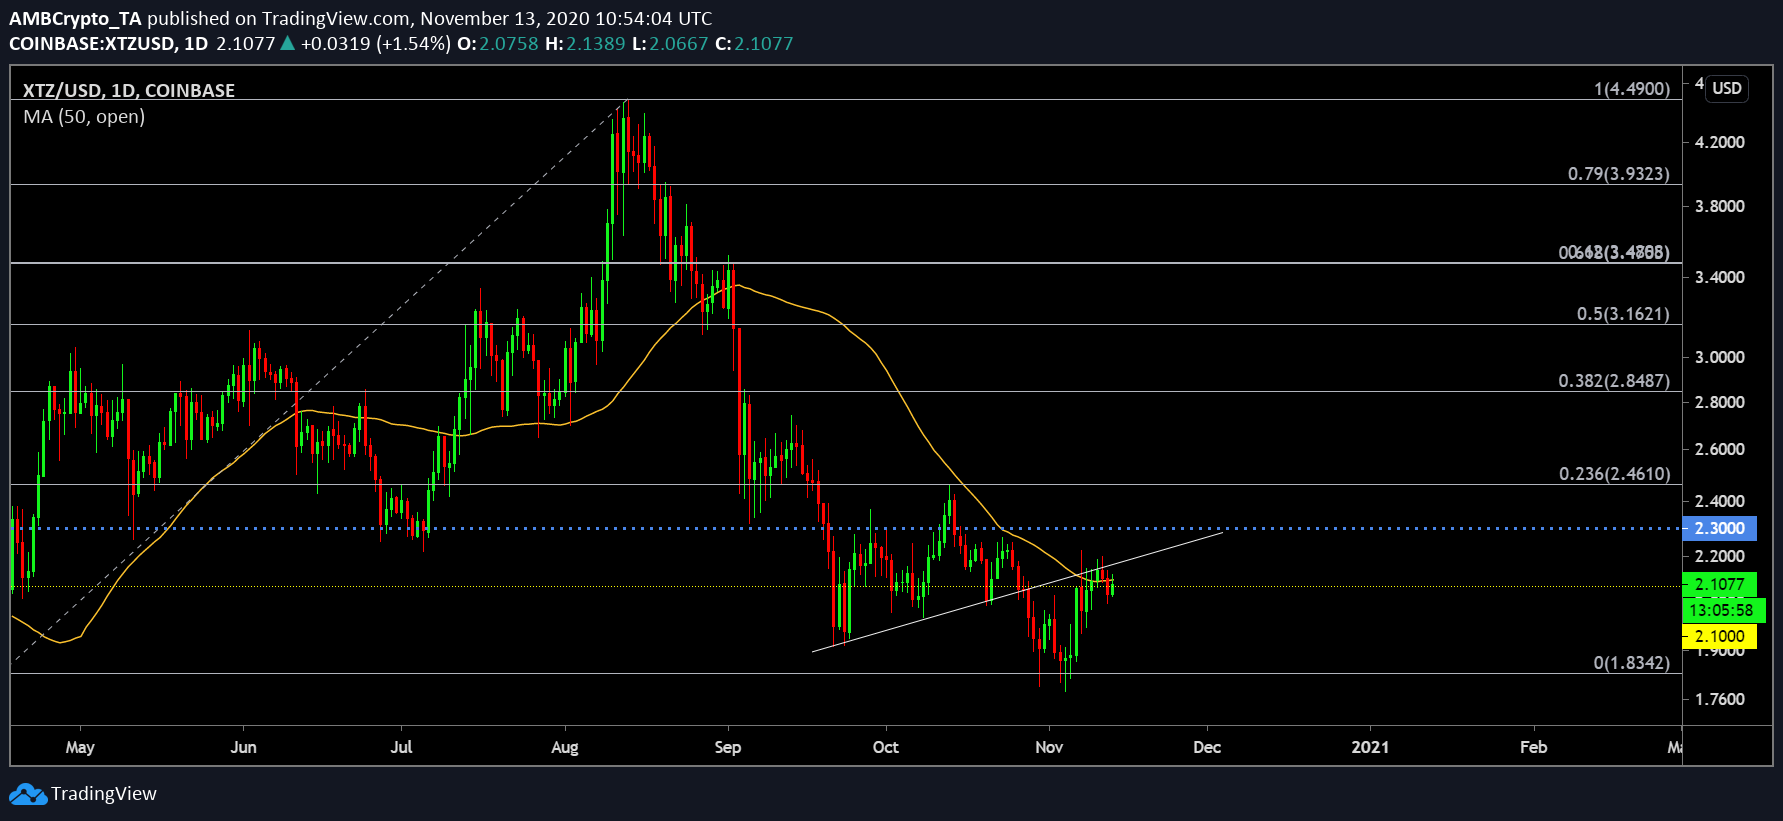
Tezos 1-day chart

Source: XTZ/USD on Trading View
Since the start of September, Tezos has failed to consolidate a position above $2.30, and with the markets turning bullish towards the start of October, its fate remains more or less the same. While a brief re-test at $2.46 can be observed, the price continued to remain under the threshold range of $2.30.
Currently, the asset is consolidating under the 50-Moving Average which is bearish in nature. According to the Fibonacci Retracement lines, Tezos continued to mediate in the lower range between 0 and 0.236 Fib, which did not reflect a lot of positivity.
Reasoning

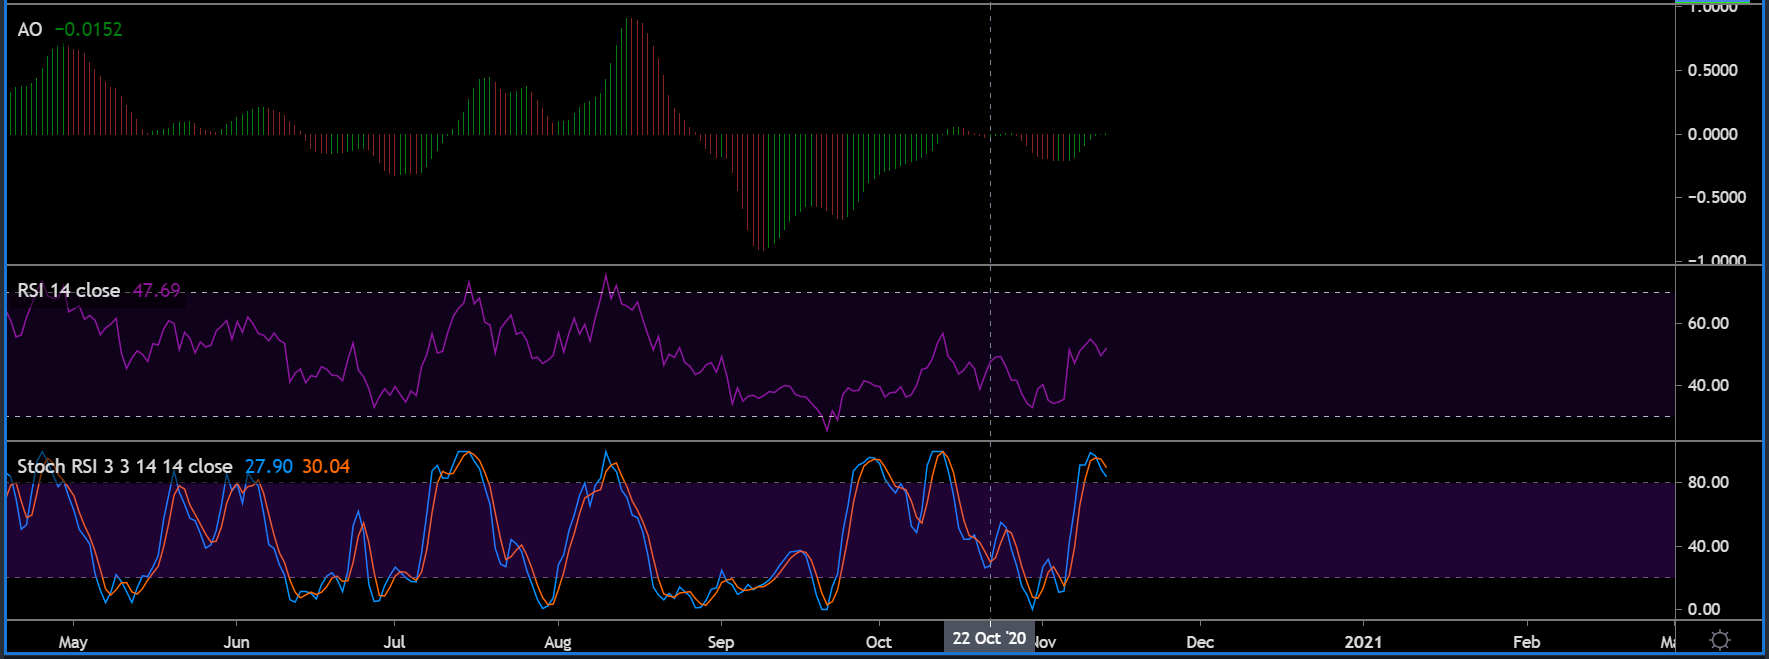
Source: XTZ/USD on Trading View
Market Indicators were not favorable either at the moment.
Awesome Oscillator indicated minimal bullish momentum for Tezos as the green candles appeared to fade. Relative Strength Index or RSI has maintained neutrality between the buyers and sellers, indicating consolidation.
Lastly, Stochastic RSI was leaning towards another drop in the charts, as the bearish indicator completed a crossover with the bullish line. While a re-test at support $1.83 might not take place, XTZ can drop down to $2.00 if the trend flipped in the near future.
Conclusion
At the moment, there isn’t a lot that can be said about Tezos from a bullish perspective as the asset is running on low fumes and sentiment. While it has managed to sustain at a lowly range, there is further doubt about its potential future if bullish sentiment continues to evade its market.


