Tezos, IOTA, OKB Price Analysis: 02 November

Bullish sentiment receded marginally as the Crypto Fear and Greed Index noted a figure of 71 at press time, compared to 72 and 75 over the past couple of days.
As far as the market’s cryptocurrencies are concerned, Tezos retested an important level as resistance and was expected to head south once again, while IOTA posted losses, but showed a divergence between the direction of the price and buy volumes. OKB saw heavy losses in mid-October and appeared to be in a phase of consolidation.
Tezos [XTZ]

Source: XTZ/USD on TradingView
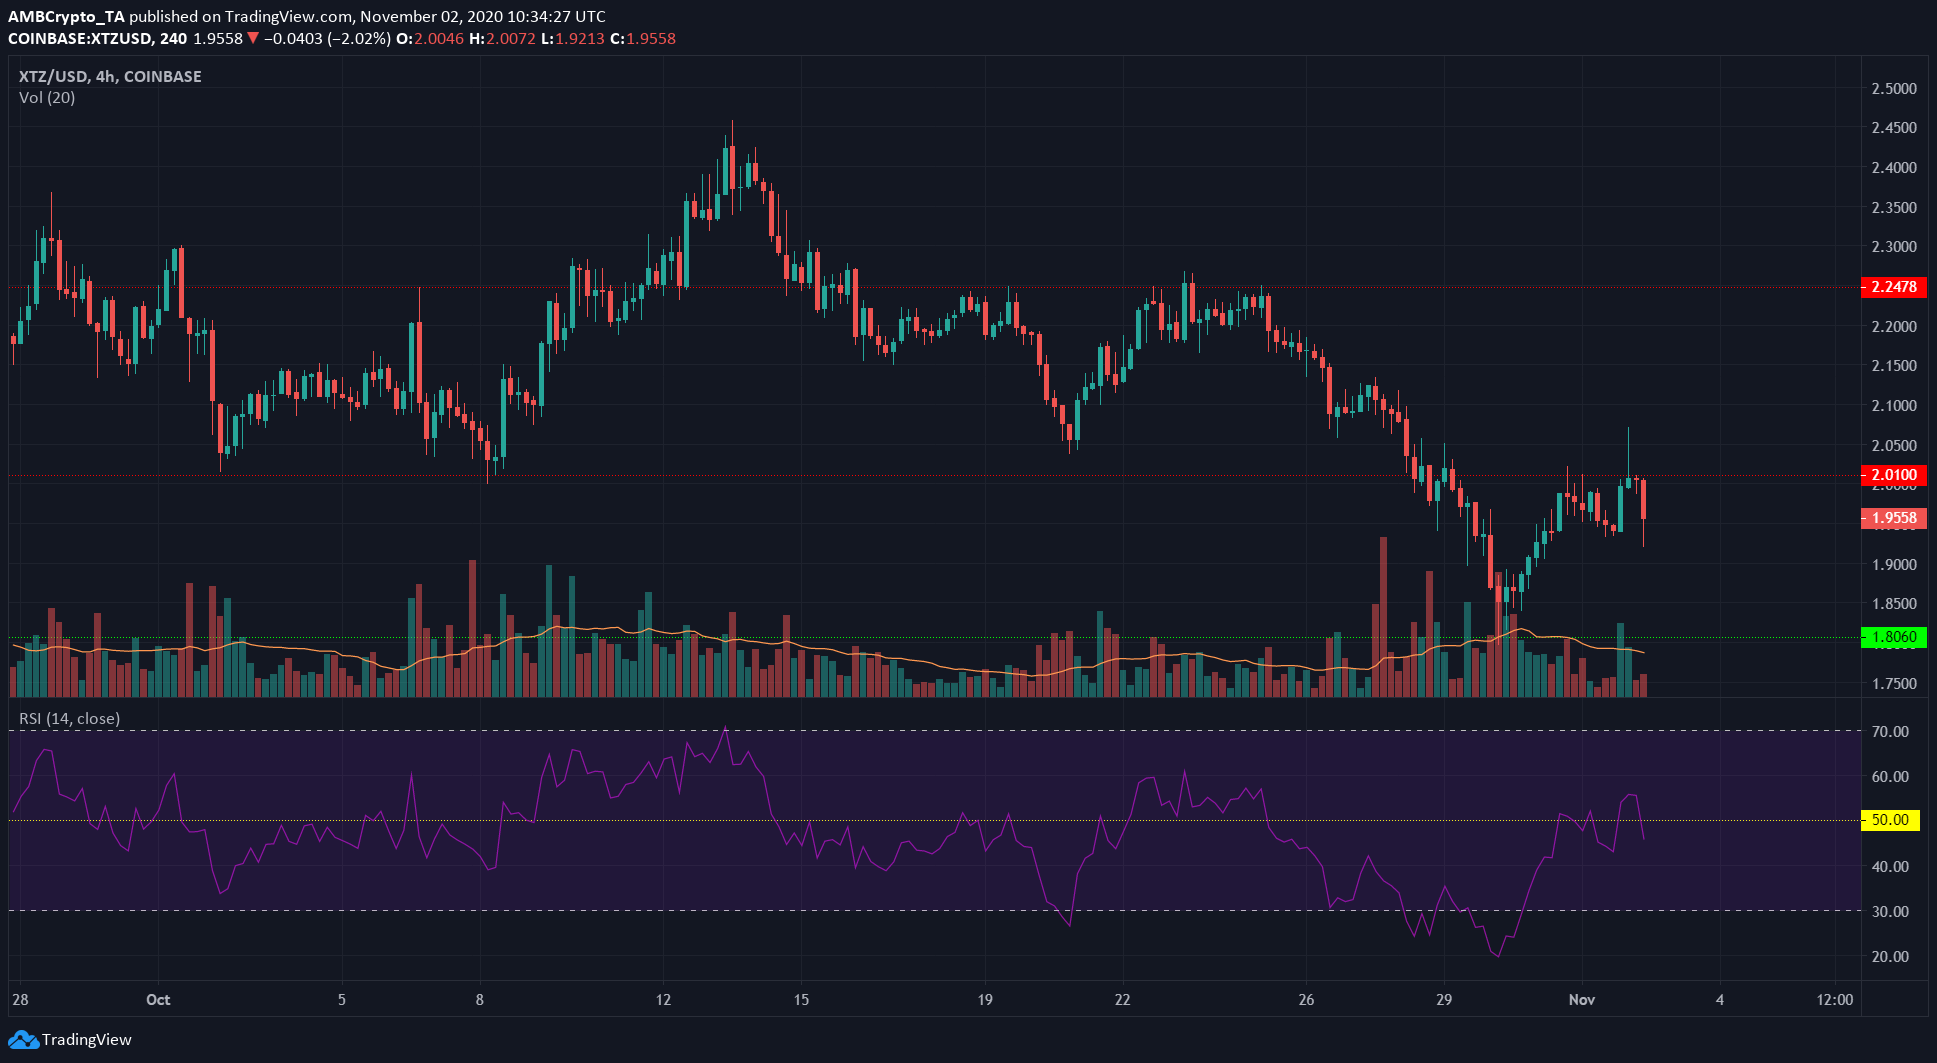
XTZ lost its support level at $2 and dropped to as low as $1.82, before a bounce upwards. The past couple of days have seen XTZ attempt, twice, to rise past the level flipped to resistance, but the bears were resolute in their stance.
The bounce off the $1.82 region of support was on low trading volume, further proof pointing towards the rise being no more than a retest of the flipped level.
The most recent attempt saw heavy trading volume and the bears emerged victorious from the skirmish at the end of the trading session.
The RSI rose to 55, but dropped under 50 once more. In conclusion, XTZ was likely to register losses in the next few hours.
IOTA

Source: IOTA/USD on TradingView
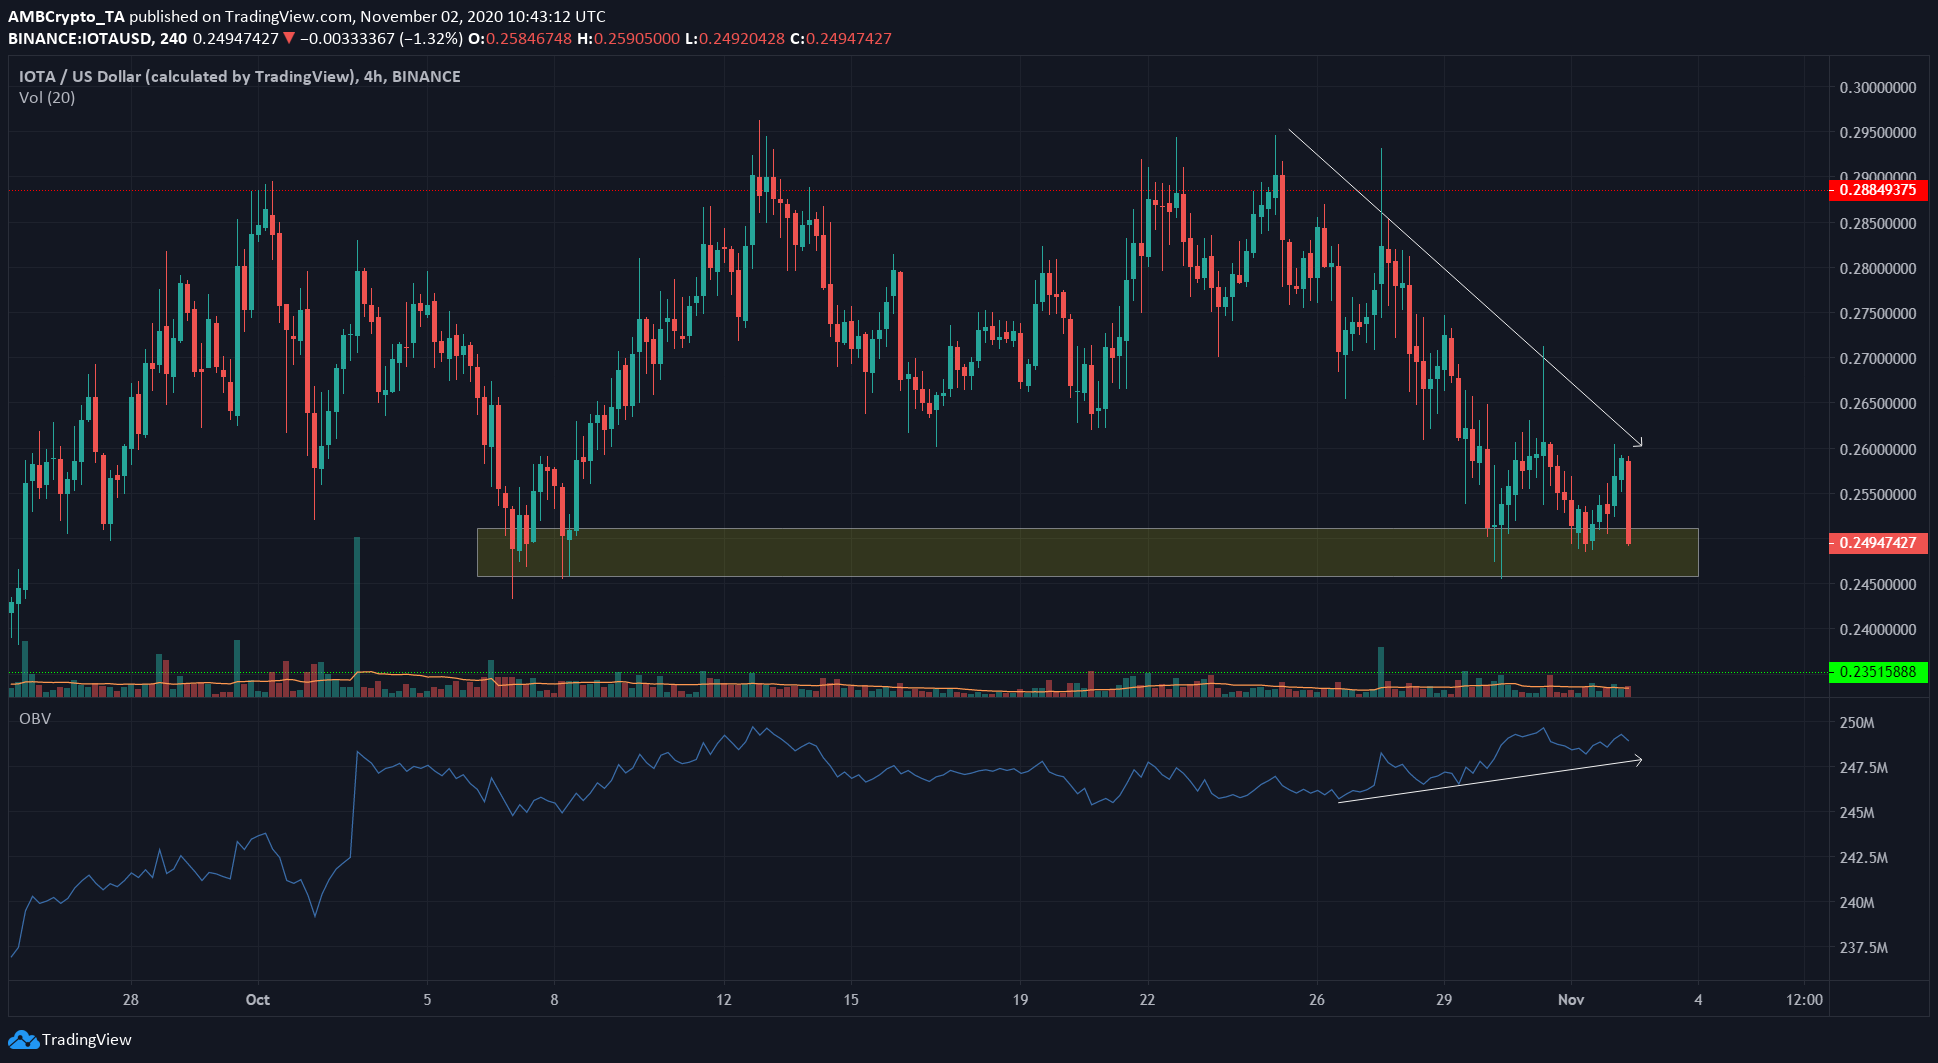
The shaded region (yellow) highlighted a region of demand for the crypto-asset over the past few days. However, a strong bearish candle was in the process of being printed.
A close below $0.245 for IOTA could push it to the next level of support at $0.235, a drop of nearly 4.4%.
The OBV showed that buying volume was trending higher, while the price registered a series of lower highs. This divergence could see the downtrend of the past few days reverse in the coming days.
IOTA recently announced that a private Tangle could be set up with one click on the AWS Marketplace, news that was received positively by users.
OKB

Source: OKB/USDT on TradingView
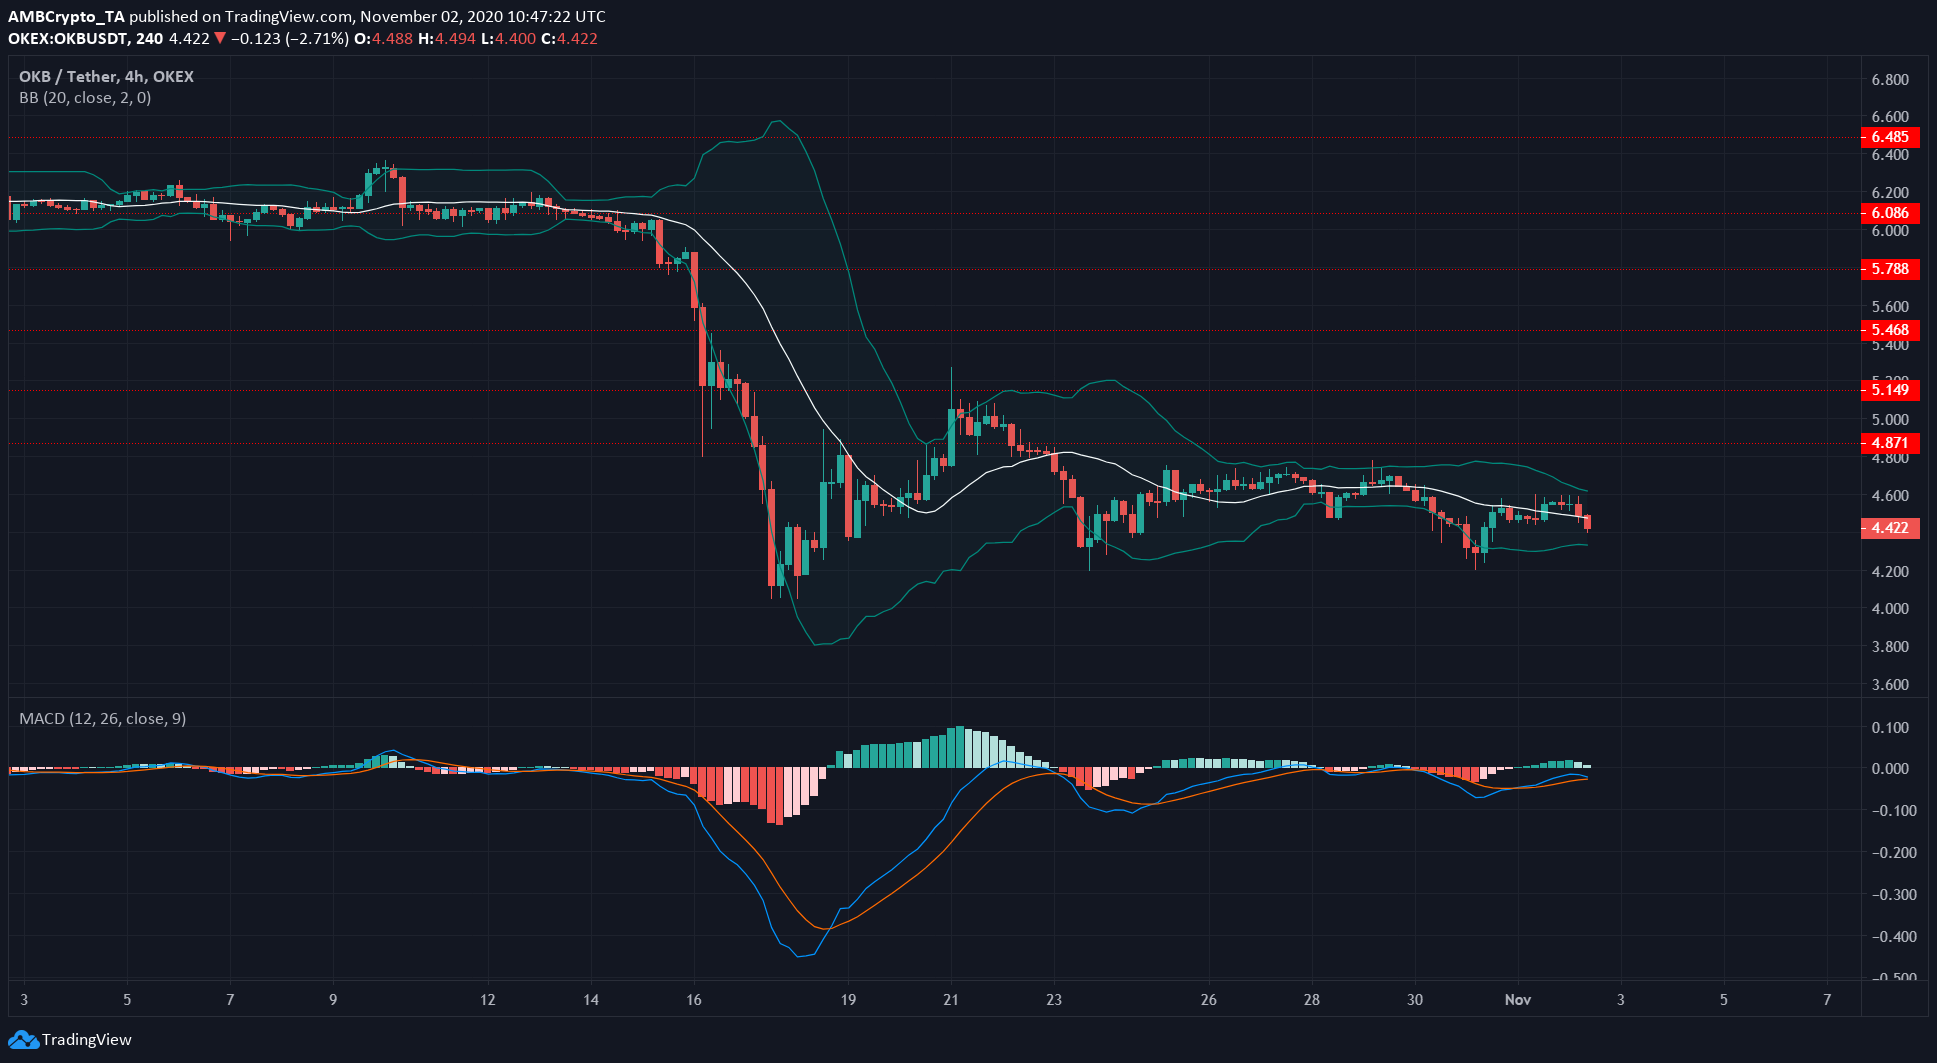
OKB had a market cap of $265 million, compared to a high of $375 million in the first week of October. OKEx’s utility token slid past multiple levels of support on the charts too.
Over the past couple of weeks, the price has traded between $4.72 and $4.35 for the most part. The Bollinger Bands were also quite tight around the price during the same time period.
The MACD line and the Signal line moved in proximity to one another over the past week, showing a lack of momentum in either direction for the crypto-asset.
Taken together, OKB could be in a phase of consolidation and was likely to offer minimal trading opportunities in the short-term.


