
Tezos burst past its resistance level on the charts, but its downtrend was unlikely to have been reversed. Further, IOTA showed signs of a bullish trend in the short-term after defending a level of support against bearish pressure.
Compound too formed a bullish reversal pattern, however, it would take more time to either validate or invalidate the pattern. A small drop was the more likely event for COMP.
Tezos [XTZ]
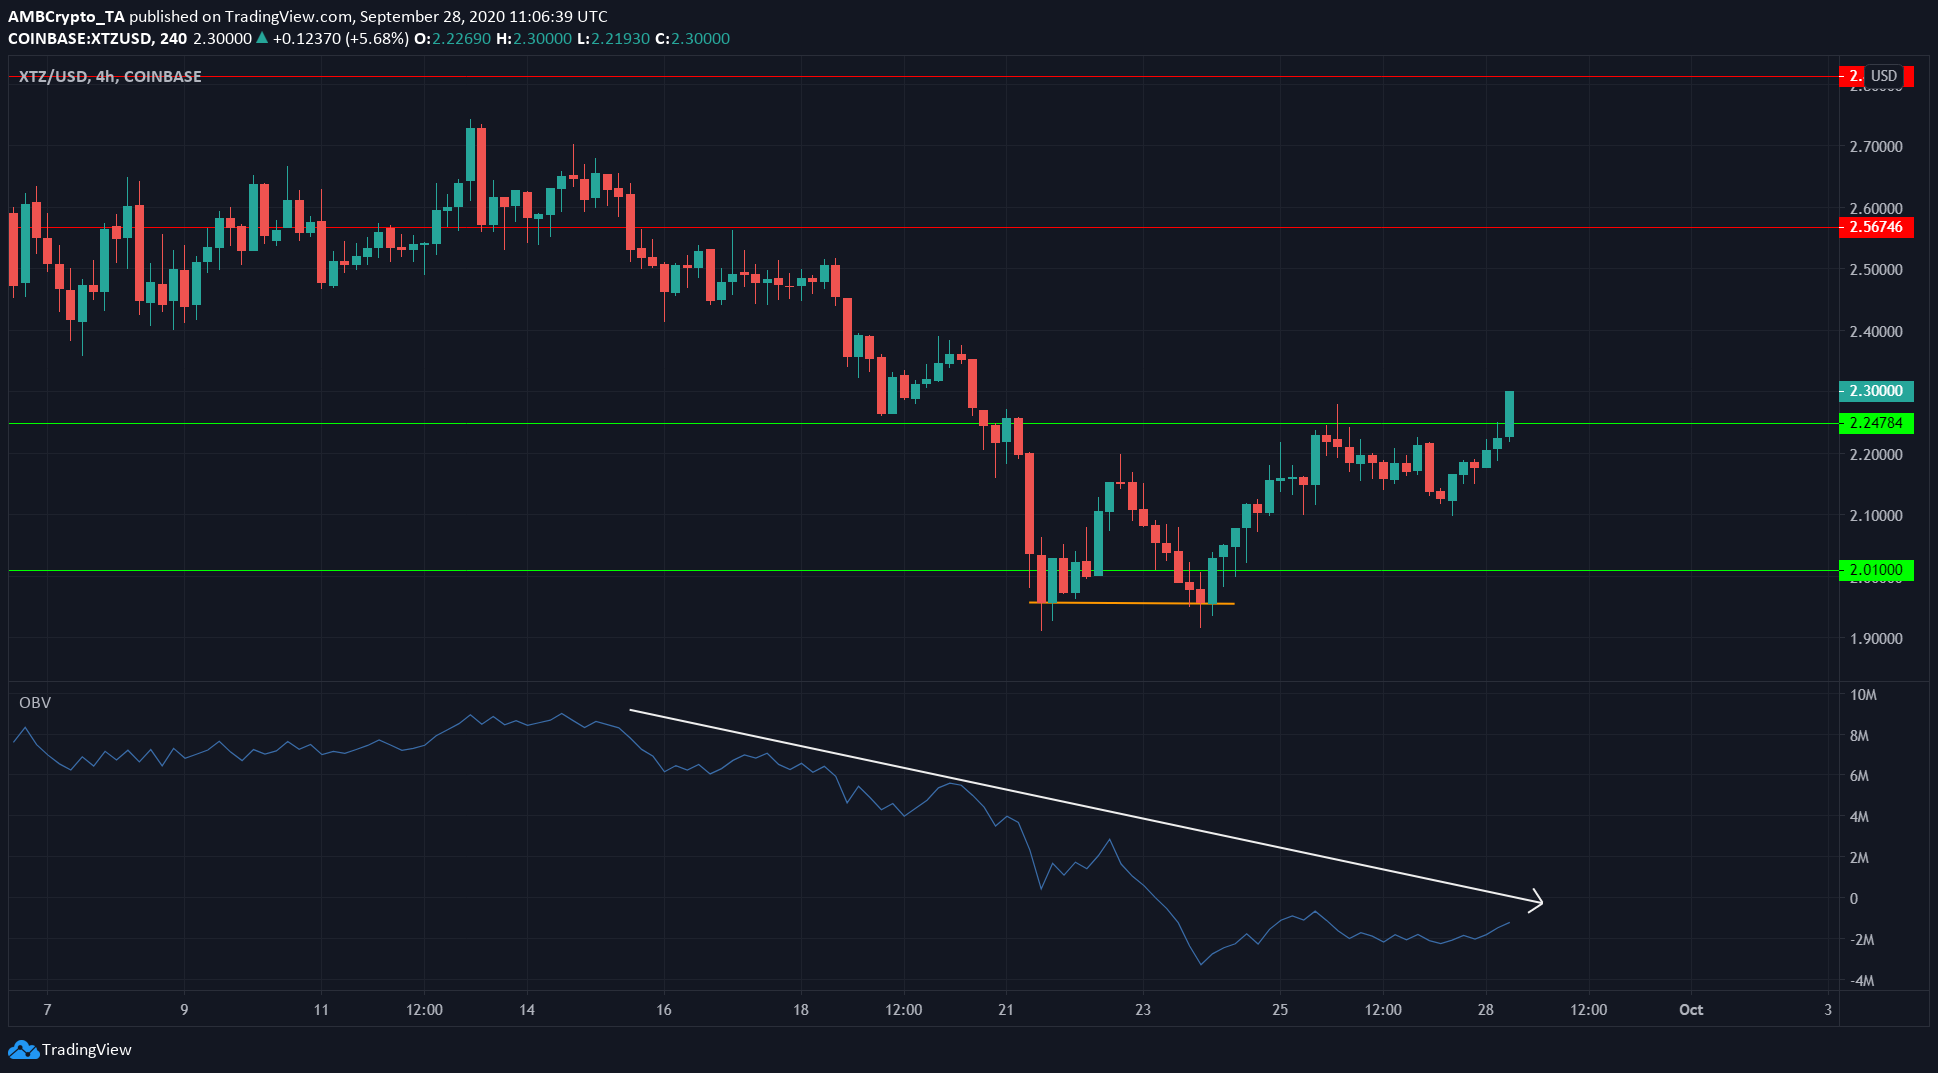
Source: XTZ/USD on TradingView
XTZ formed a double bottom pattern (Adam & Adam), highlighted in orange, and a break above the crest between the two trenches is generally indicative of a surge equal to about 70% of the length of the crest.
In this case, the projected target for XTZ would be $2.29 as a take profit for a long position opened near $2.15.
However, the longer-term trend for XTZ remained bearish. This can be expected to be a mere bounce. As shown by the OBV, recent buying pressure has been nowhere close to the selling pressure.
IOTA
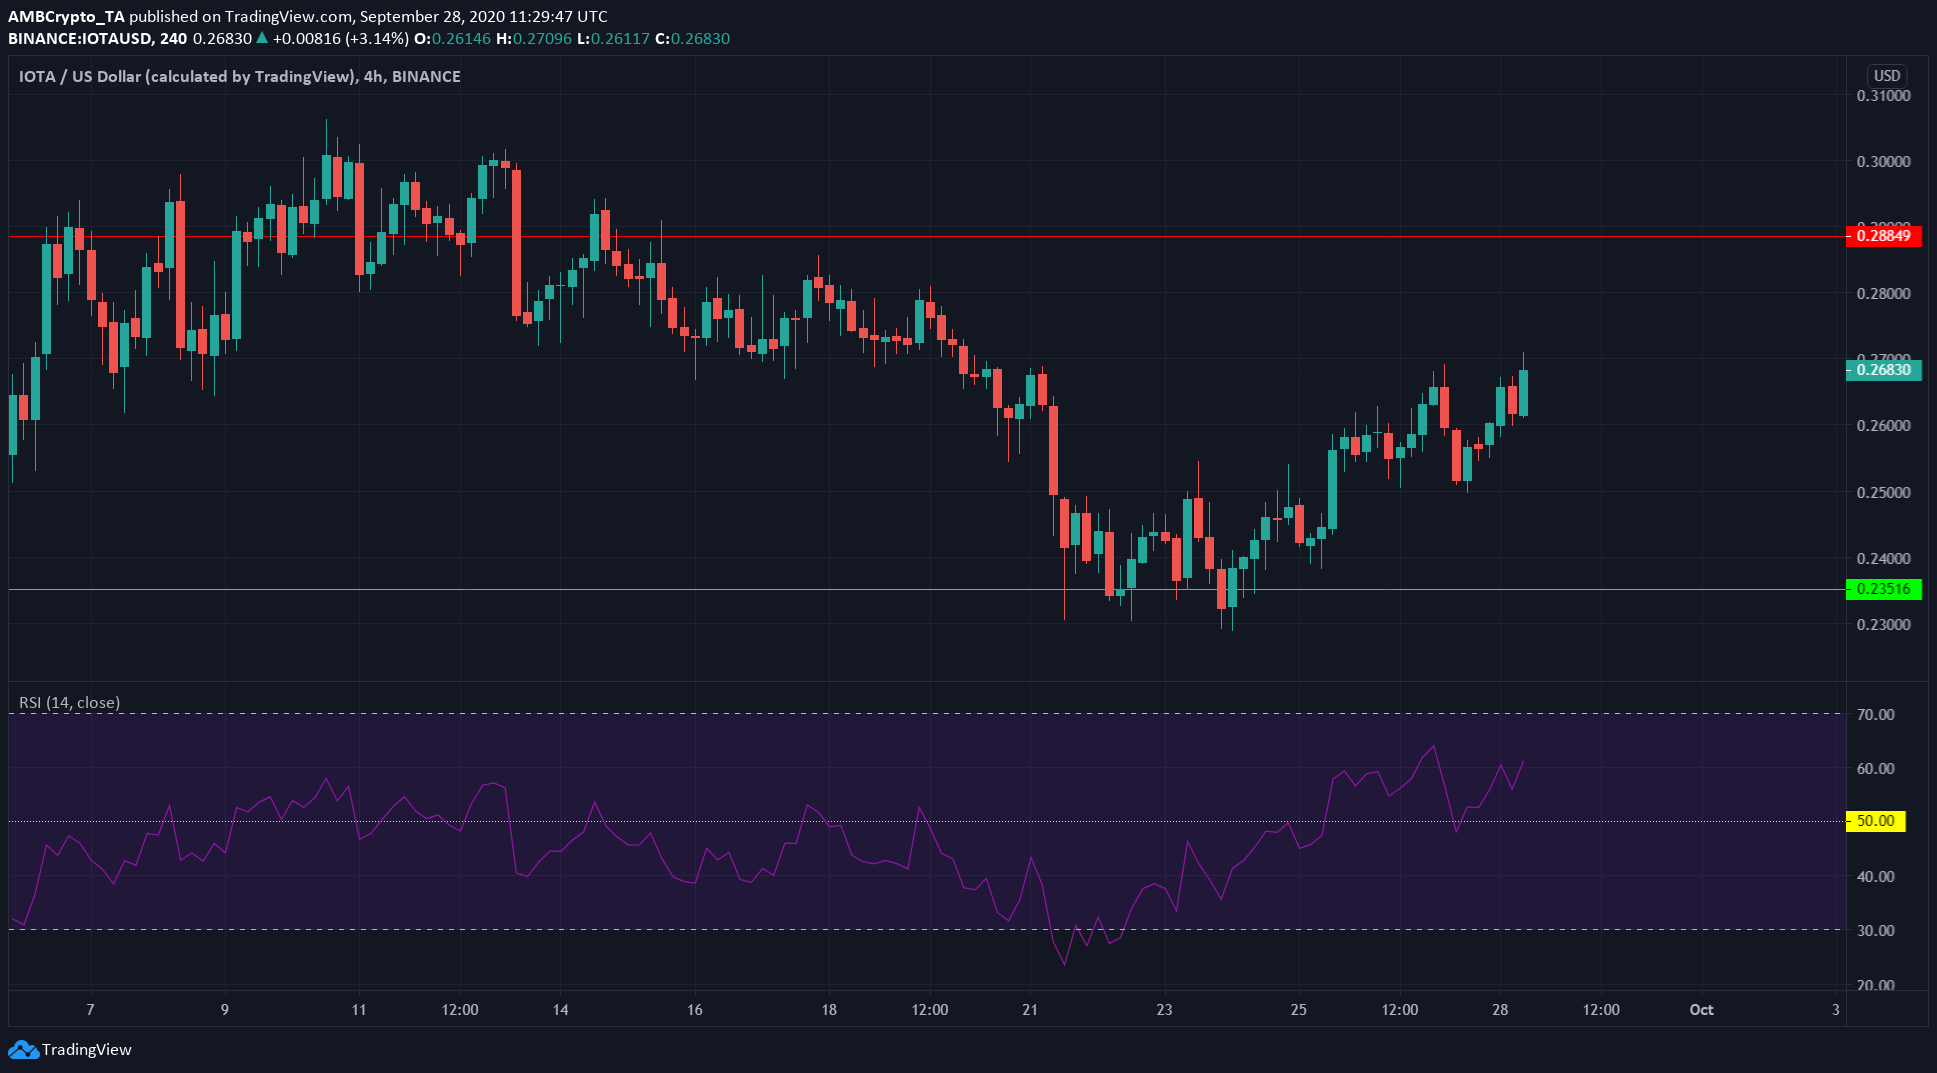
Source: IOTA/USD on TradingView
IOTA managed to bounce, twice in quick succession, off the level of support at $0.235. Another test of the same level in the near future would be bearish.
However, the outlook had changed for the asset in the near-term. The RSI showed a bullish value of 62 and had not dipped under the neutral 50 zone in the past few days. This suggested that an uptrend was in progress.
The next level of resistance for IOTA lay at $0.288, although $0.27 might also be seen as a selling opportunity by traders and could hold up the price’s upward progress.
Compound [COMP]
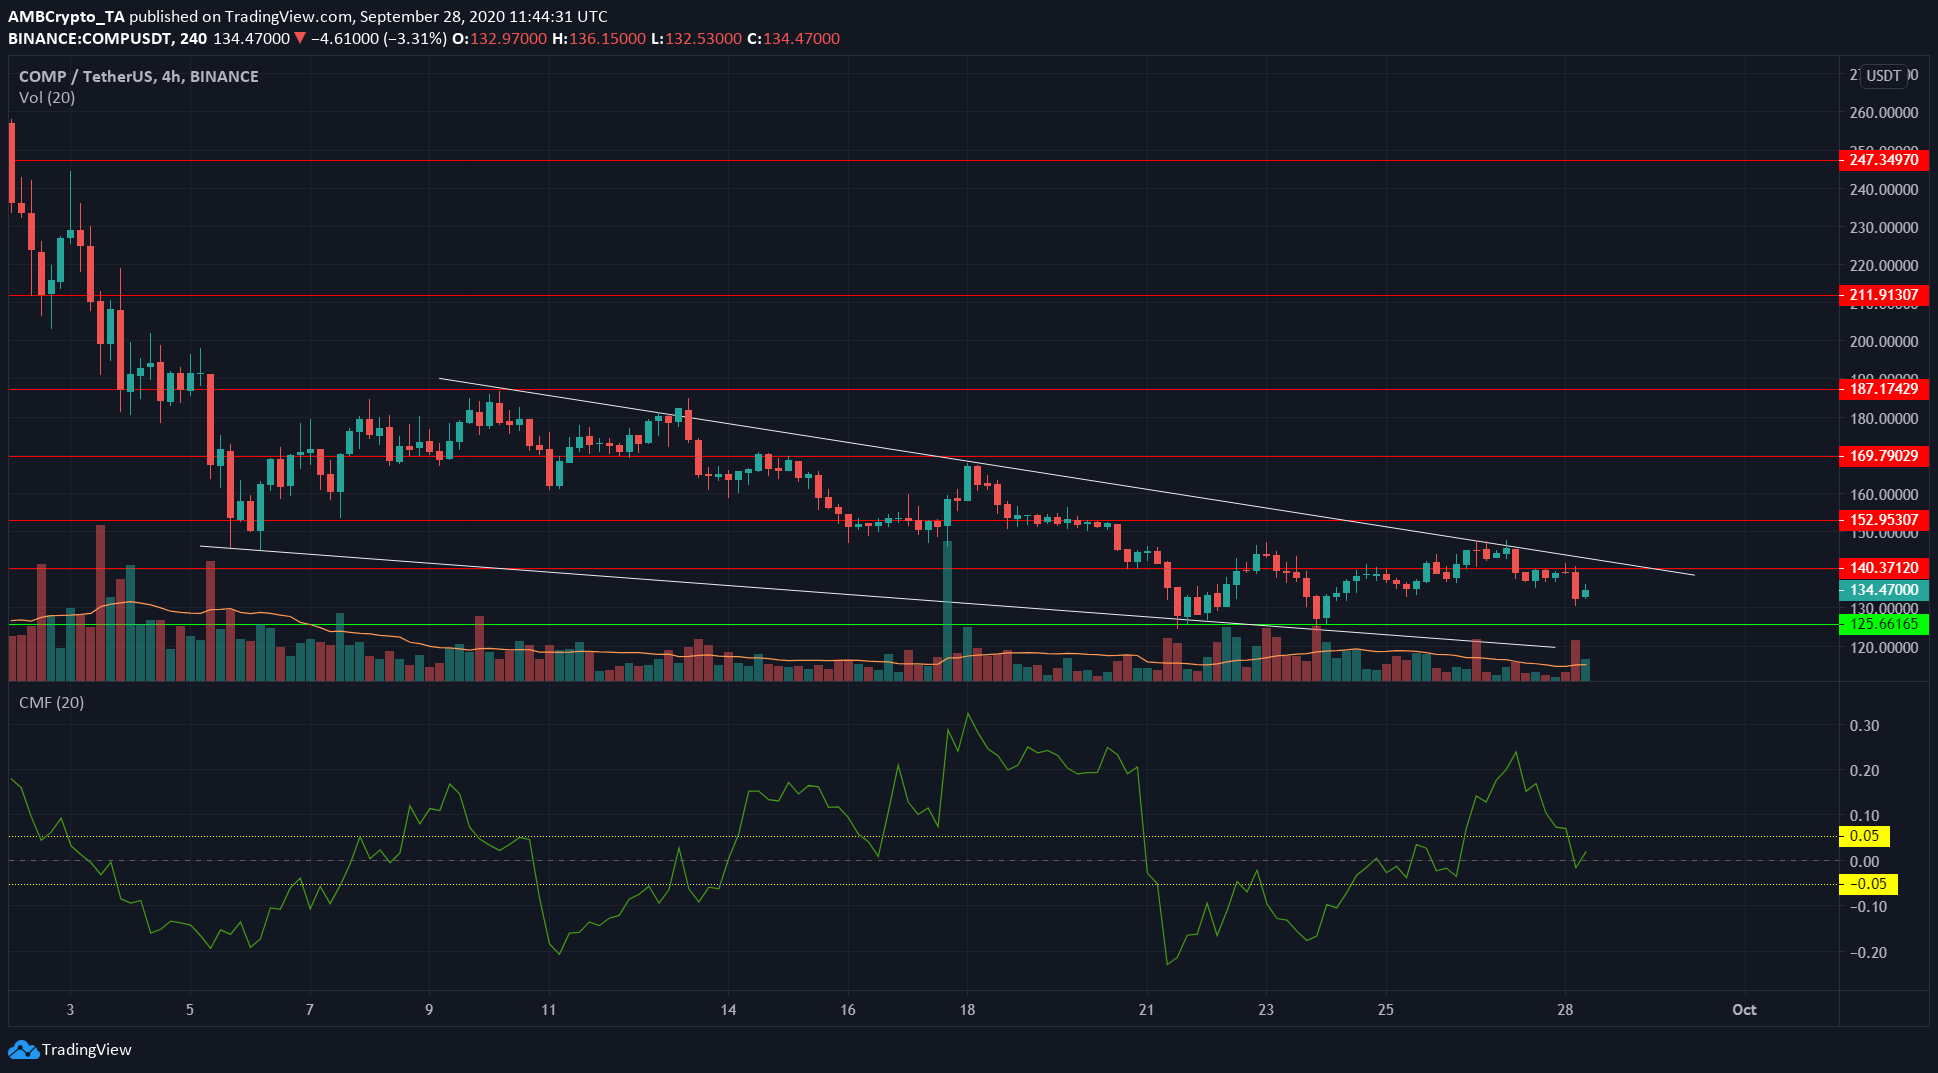
Source: COMP/USDT on TradingView
COMP rose past its resistance level at $140 recently, but was unable to hold on to the level. In fact, it lost the same level on a trading session with above-average volume.
In the near-term, the Chaikin Money Flow showed a balance between buying and selling pressure. The CMF has also stayed above the neutral line for the most part, contradicting the price which has been moving lower.
Highlighted in white was the bullish reversal pattern forming on the 4-hour charts for COMP. The falling wedge pattern would be validated when price breaks past the upper trendline, near the resistance at $140.
The CMF contradiction, showing capital inflows into the markets over the past couple weeks, implies a breakout towards further levels of resistance.