
The larger market sentiment has shifted strongly in the favor of the bulls over the past few days. In fact, Bitcoin refused to drop below $17,800, despite corrections setting in. In the time that it traded sideways, the altcoin markets have seen capital flow into them. Stellar Lumens and FTX Token posted remarkable gains over the past week, while Waves has more than doubled its value since early November.
Stellar Lumens [XLM]
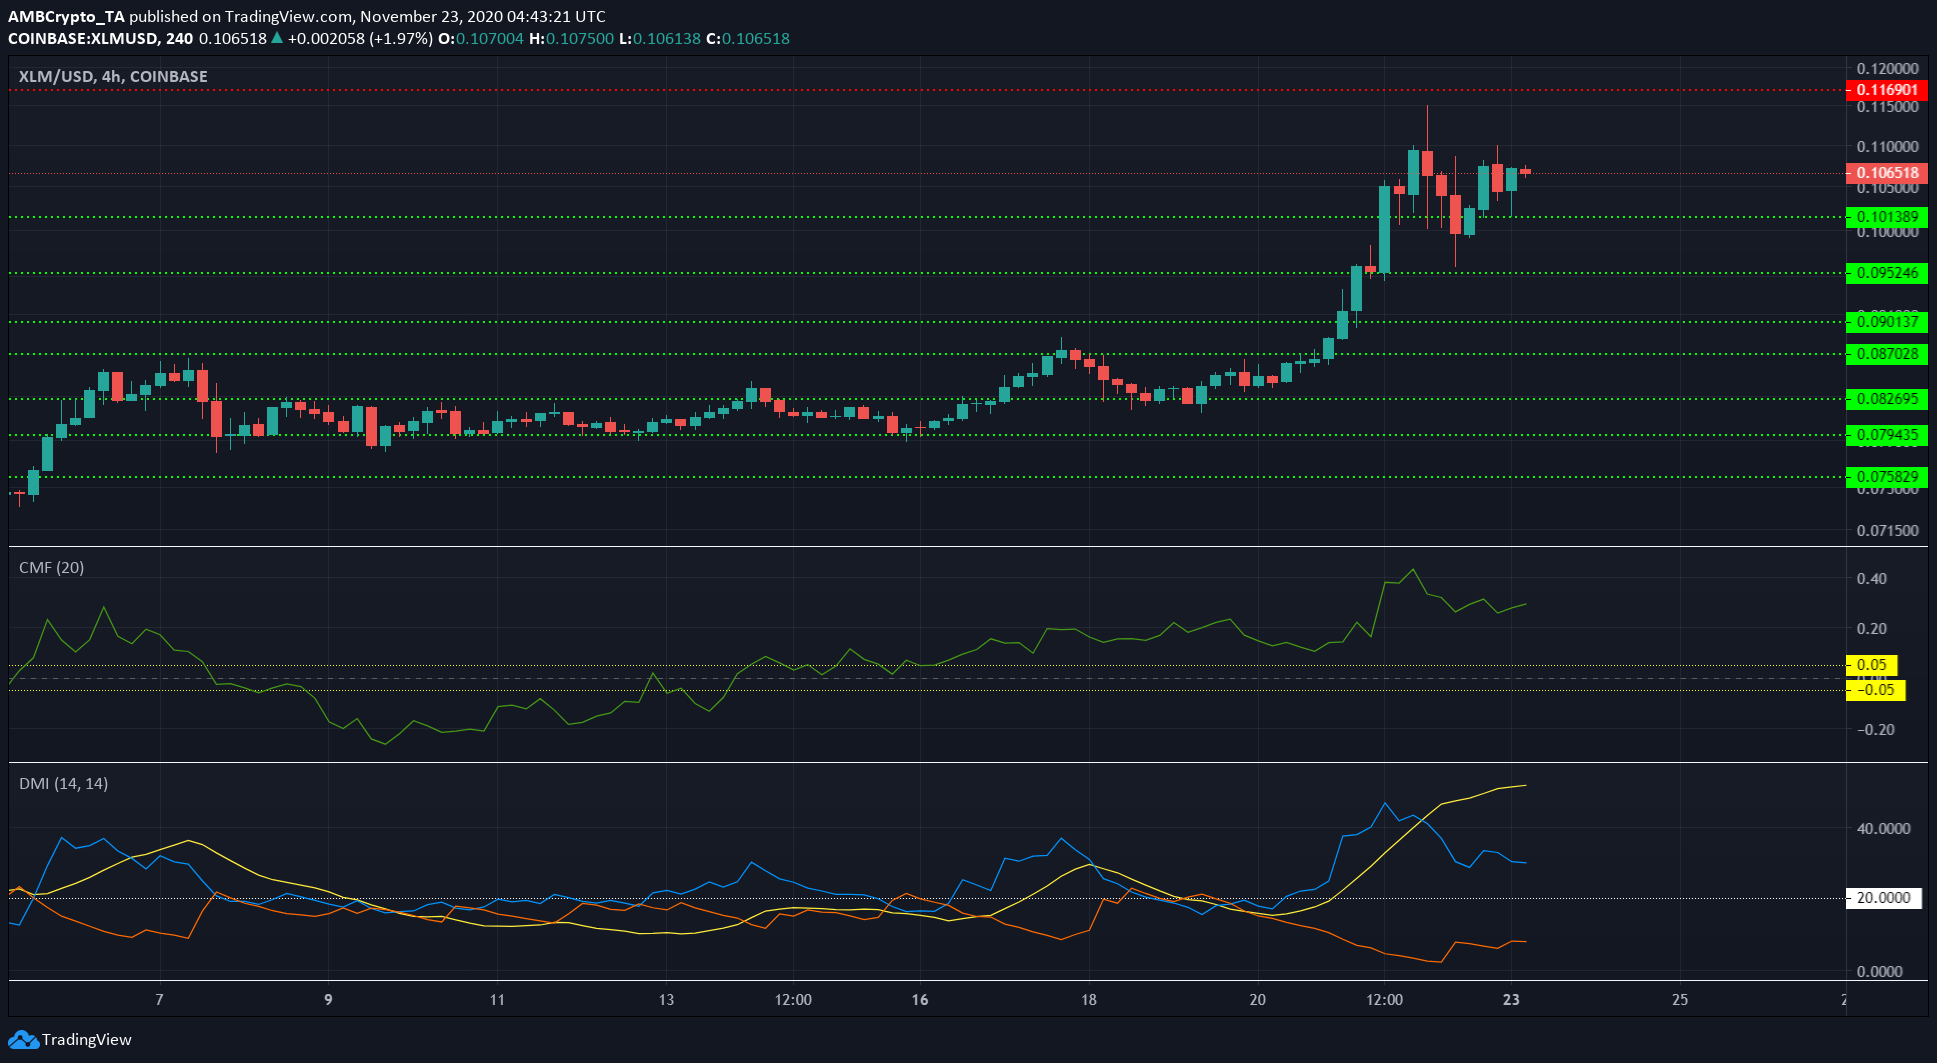
Source: XLM/USD on TradingView
XLM has been strongly bullish since its breakout past the level of resistance at $0.09. The Directional Movement Index showed that a strong uptrend was in progress as the ADX (yellow) was well above 20 on the indicator.
The CMF also showed capital flowing into the market to indicate strong buying pressure.
The price climbed to a high of $.115, but it was forced to pull back to re-test support at $0.1. However, bullish momentum was not yet exhausted and another attempt at breaching the $0.116-resistance level is possible in the coming days.
In other news, Settle Network recently launched two stablecoins, ARST and BRSL, in Argentina and Brazil, respectively, in partnership with Stellar.
Waves [WAVES]
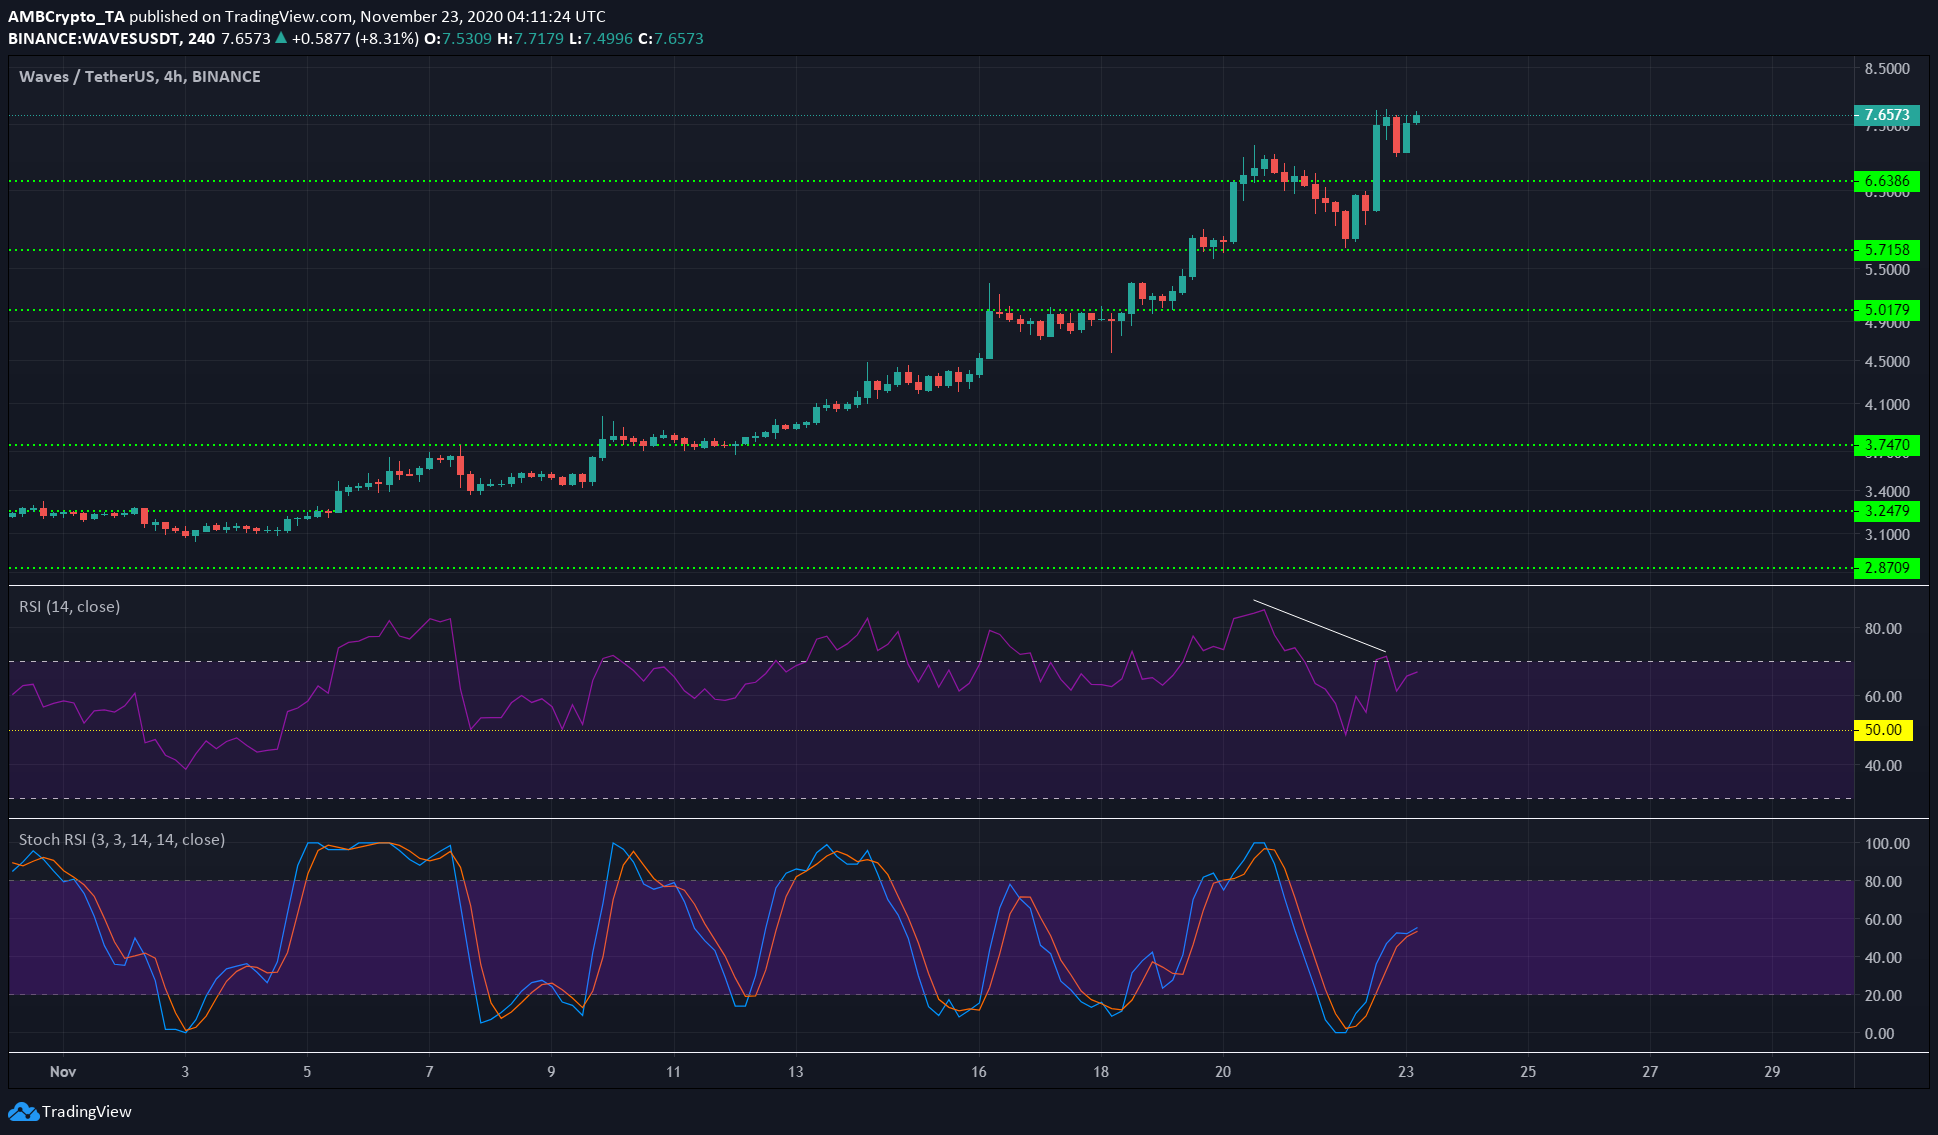
Source: WAVES/USDT on TradingView
Waves exhibited a bearish divergence between the price and the momentum indicator (RSI) on the charts and subsequently, its price fell by 7.5% in a single trading session.
That was the extent of the pullback as WAVES soon appeared to be raring to climb again. Further, the Stochastic RSI showed that WAVES was not yet overbought and that it had room for more upside.
The RSI was noting a value of 66 to indicate bullish momentum, with the next level of resistance lying at $8.
FTX Token [FTT]
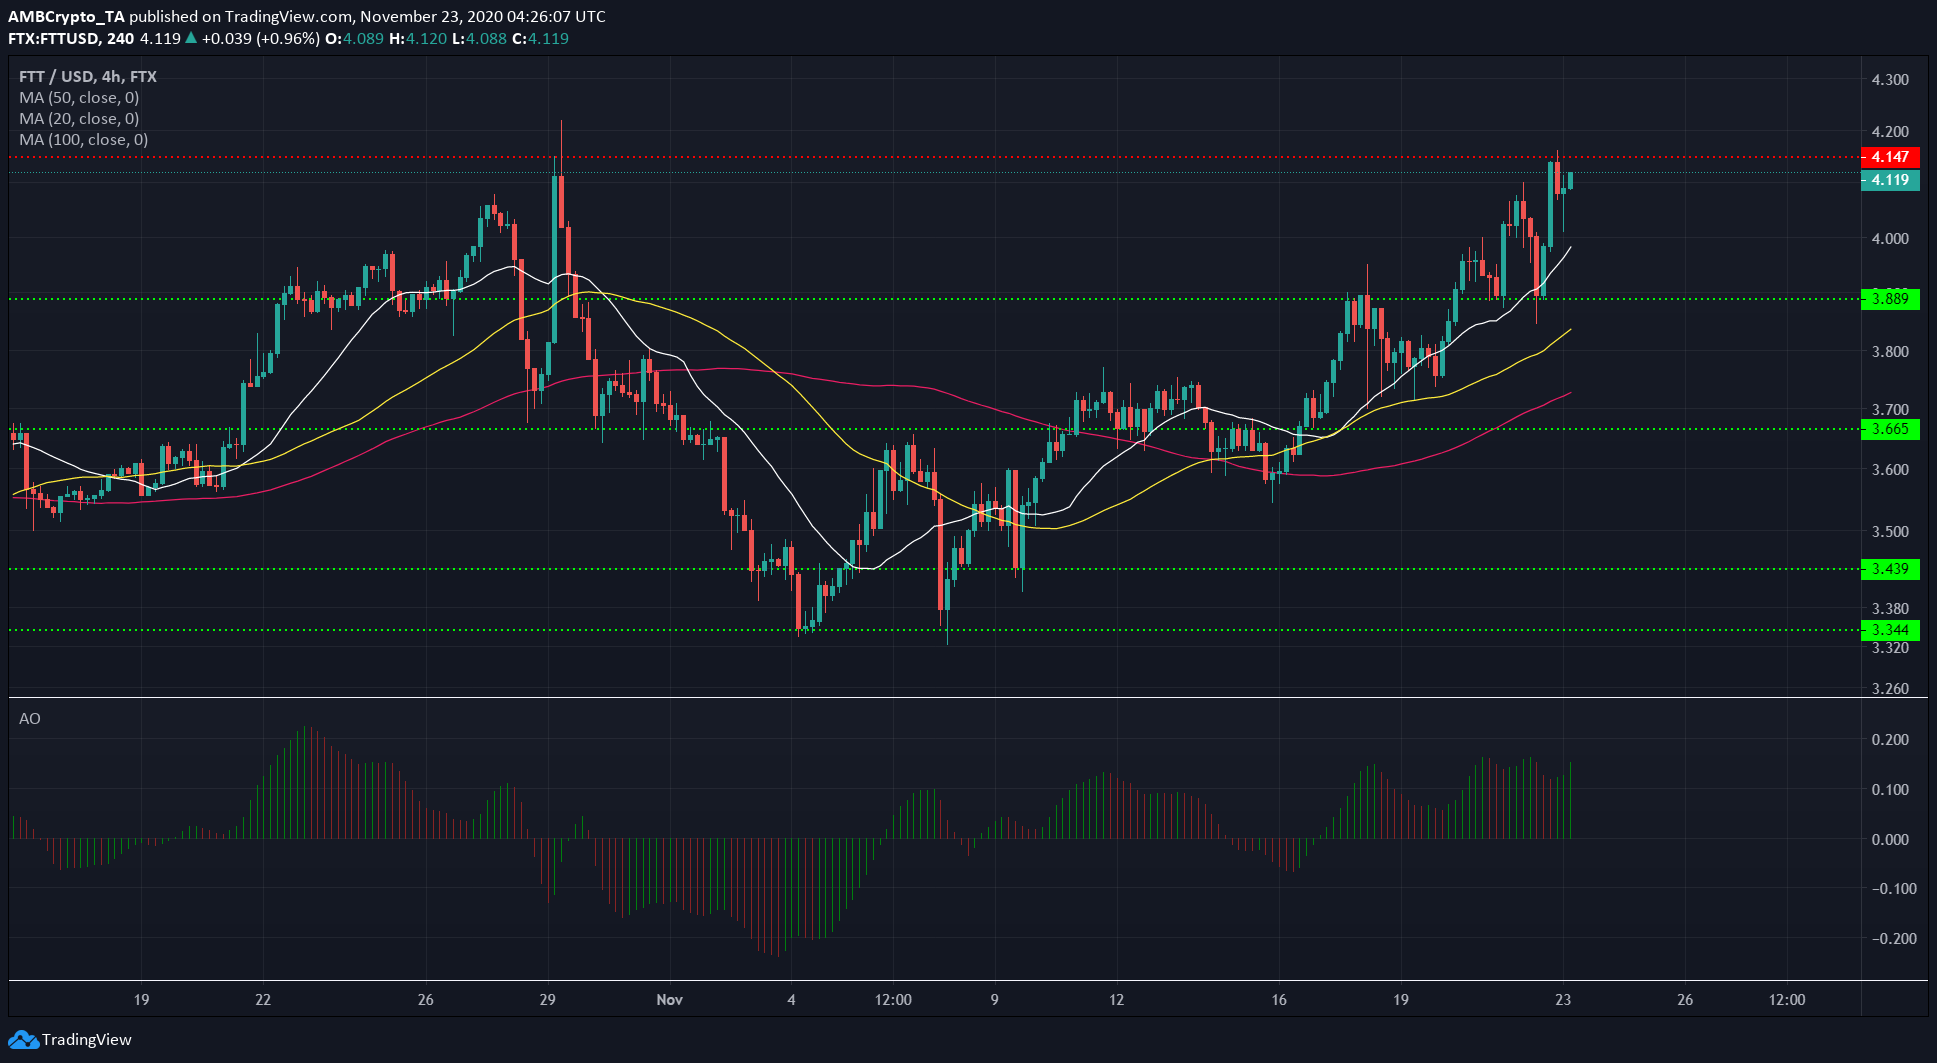
Source: FTT/USD on TradingView
FTT approached the resistance at $4.15 with strong bullish momentum, as indicated by the Awesome Oscillator.
The past three weeks have seen strong buyer interest for the token, interest that has driven the price upwards. The 20 SMA (white), 50 SMA (yellow), and 100 SMA (pink) were arrayed to indicate strong short and medium-term bullishness.
It seemed likely that FTT would flip the resistance level at $4.15 to support over the next few trading sessions. A move to the downside can be expected to find support at the 20-period moving average and the psychological $4-level.