
NEM’s strong performance over the past couple of weeks could see a setback after it formed a bearish reversal pattern on the charts, a development suggesting that it might lose a level of support at $0.169. Further, while Stellar Lumens was heading towards a level of support at $0.18, DigiByte was oscillating between two levels and showed no signs of a breakout yet.
Stellar Lumens [XLM]
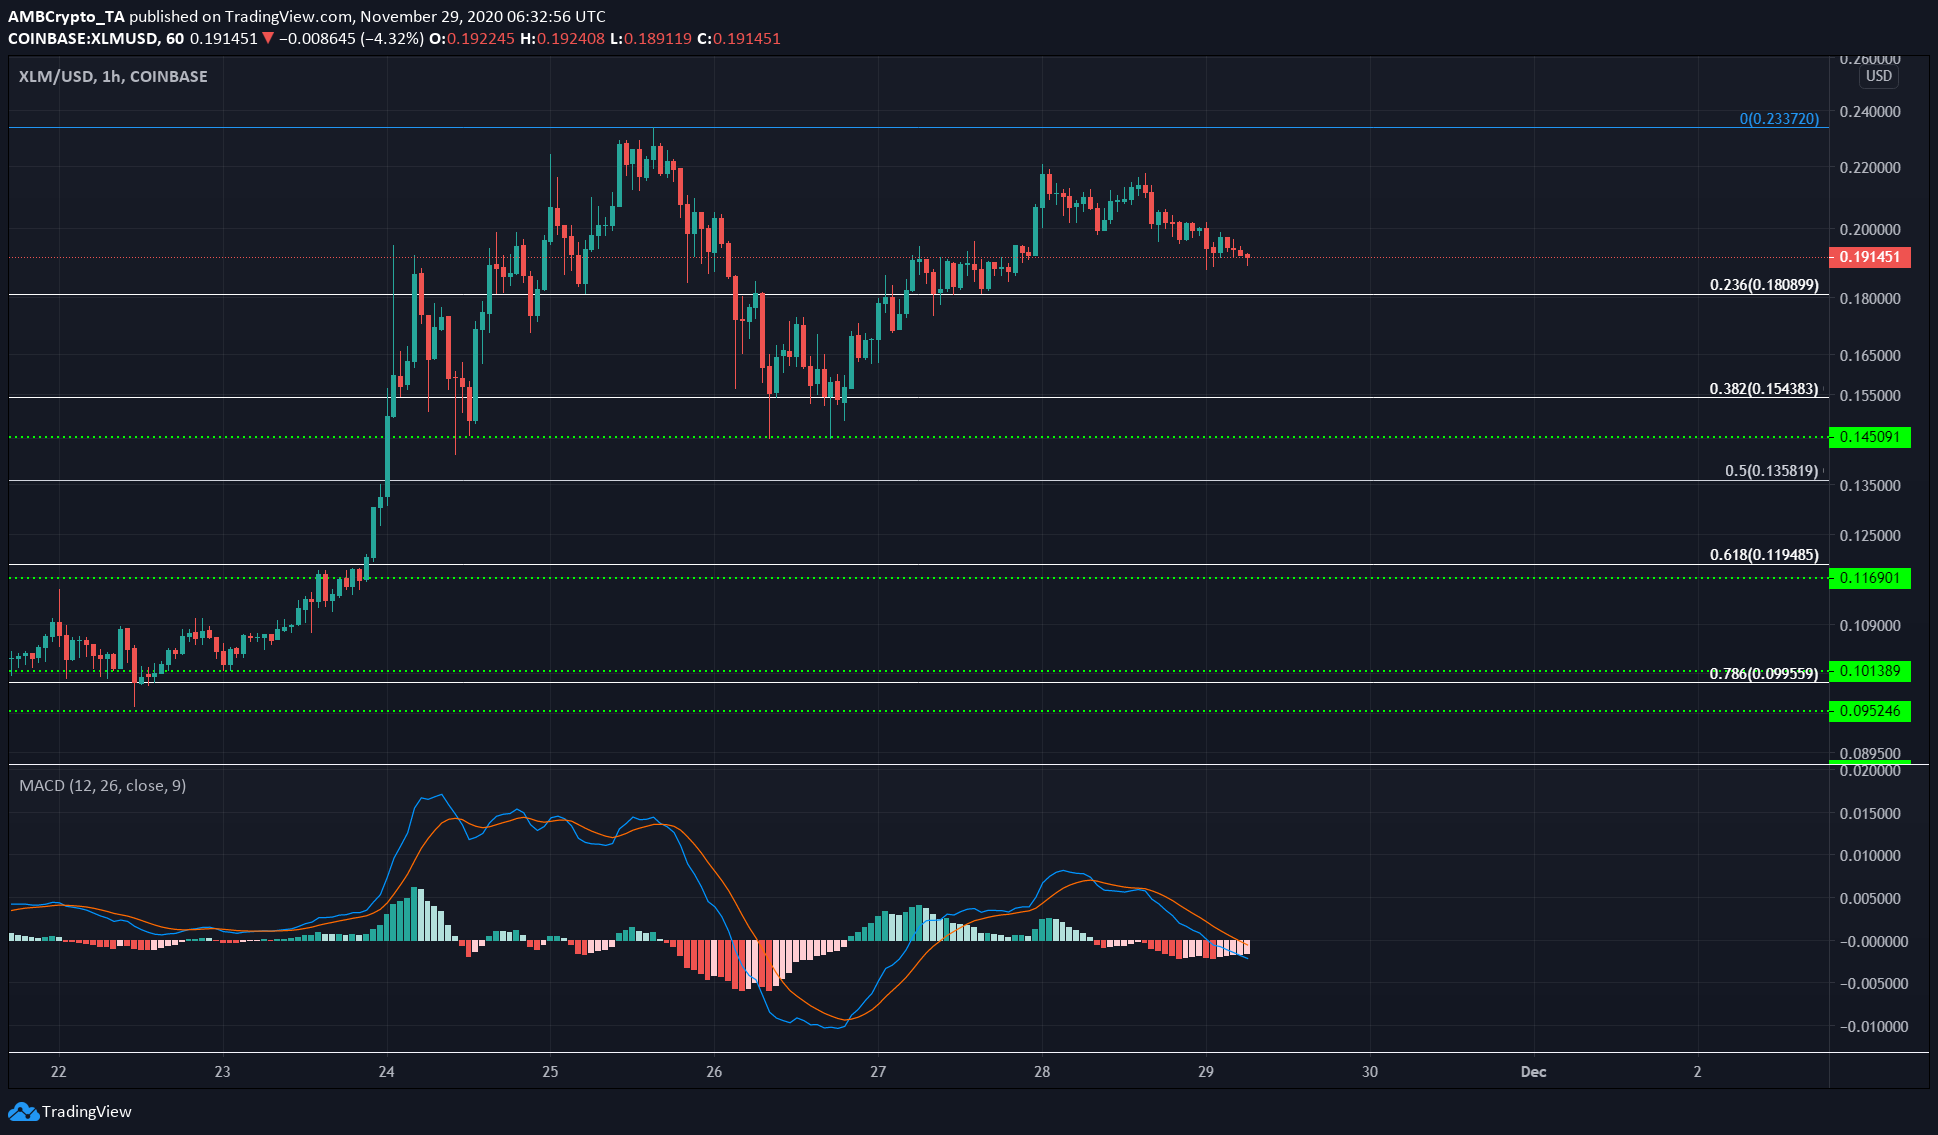
Source: XLM/USD on TradingView
The hourly chart for XLM showed some bearish momentum building in recent hours. It was gradual and not yet strong, however. The Fibonacci Retracement levels at 23.6% and 38.2% levels can be expected to offer support to XLM over the next few hours.
Over the longer timeframe, however, XLM was still bullish. On the hourly charts, the MACD formed a bearish crossover and crossed under the zero line to underline the strengthening bearishness in the market.
NEM [XEM]
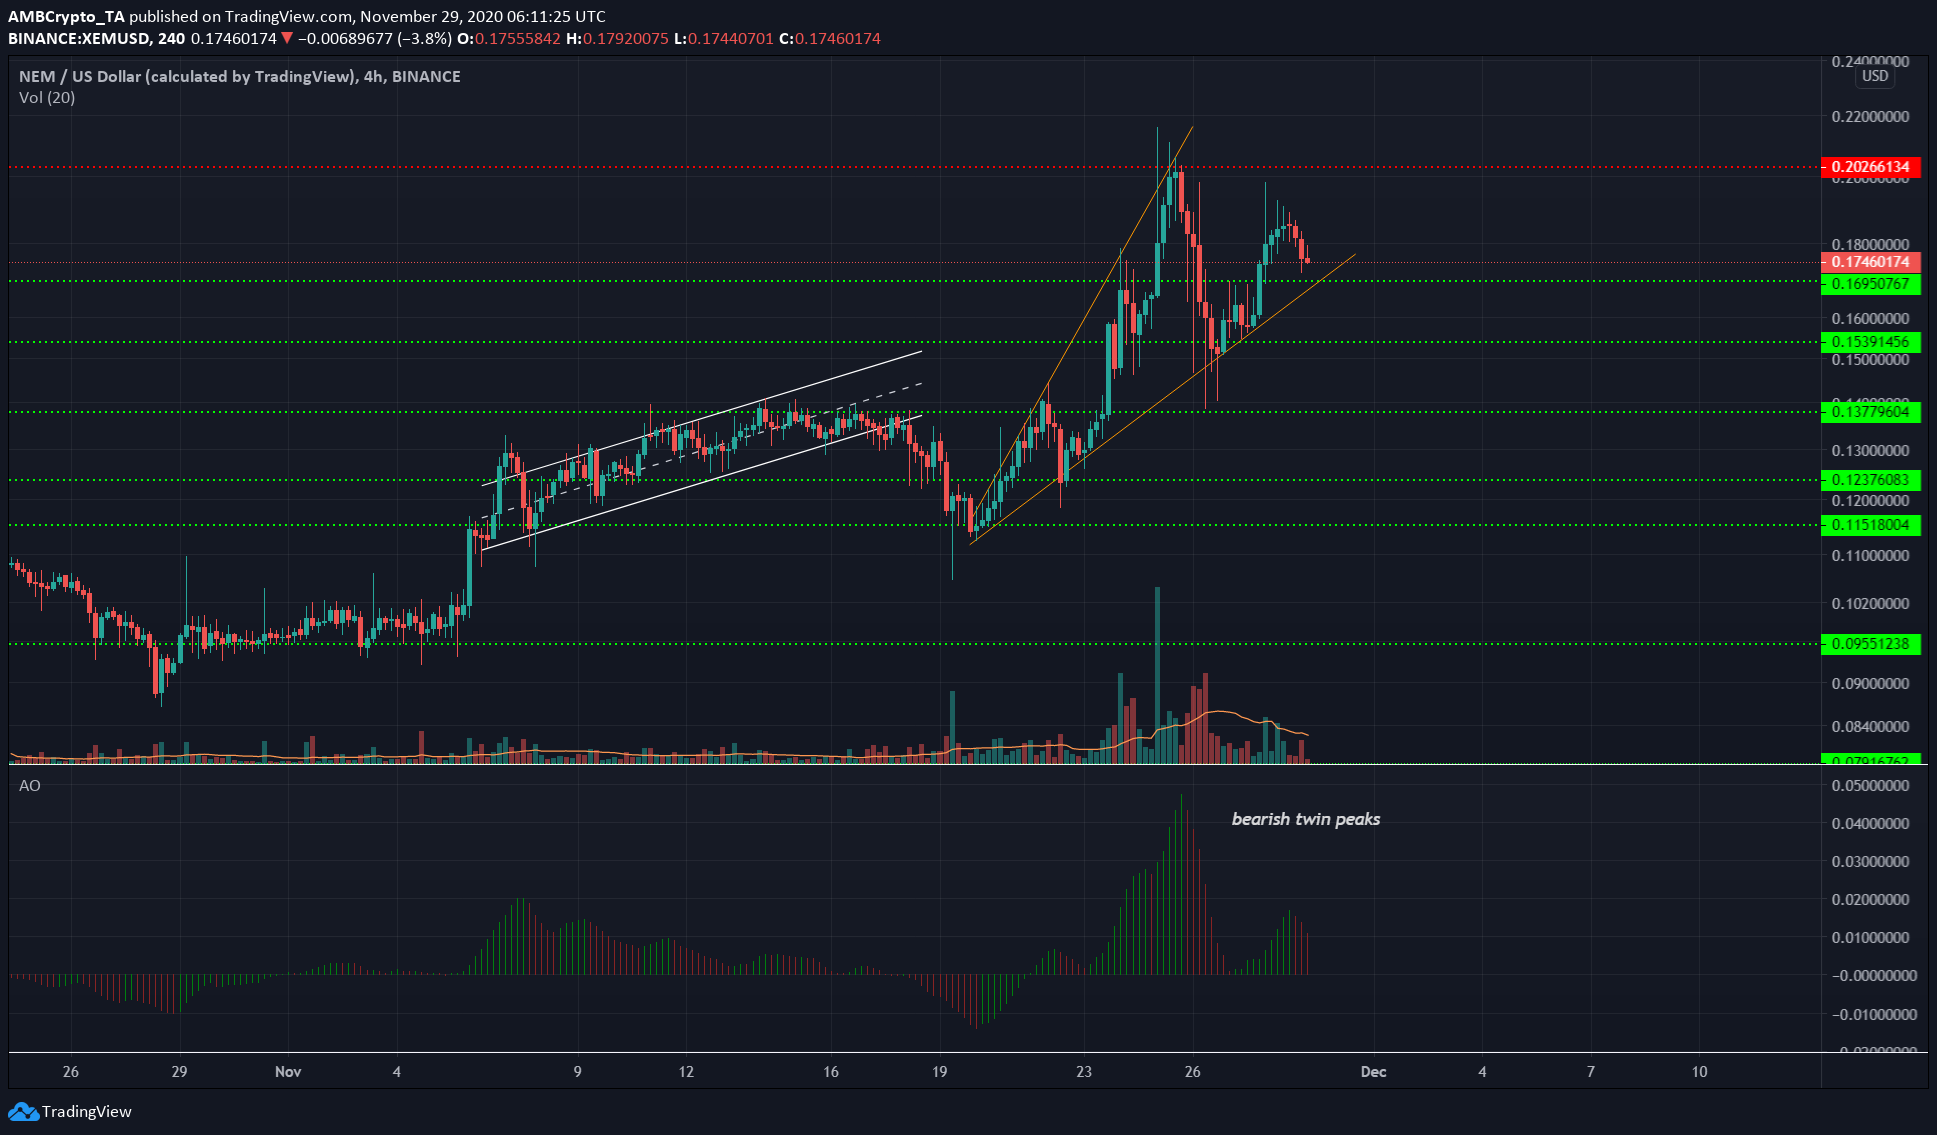
Source: XEM/USD on TradingView
XEM formed an ascending broadening wedge, a bearish reversal pattern. A level of support lay for XEM at $0.169. A close below this level and the lower ascending trendline could see the price drop.
Finally, the Awesome Oscillator developed a bearish twin peaks setup and suggested that XEM was likely to face losses in the coming hours.
A price target for XEM’s bears, if $0.169 is flipped to resistance, would be $0.137 in the near-term.
DigiByte [DGB]
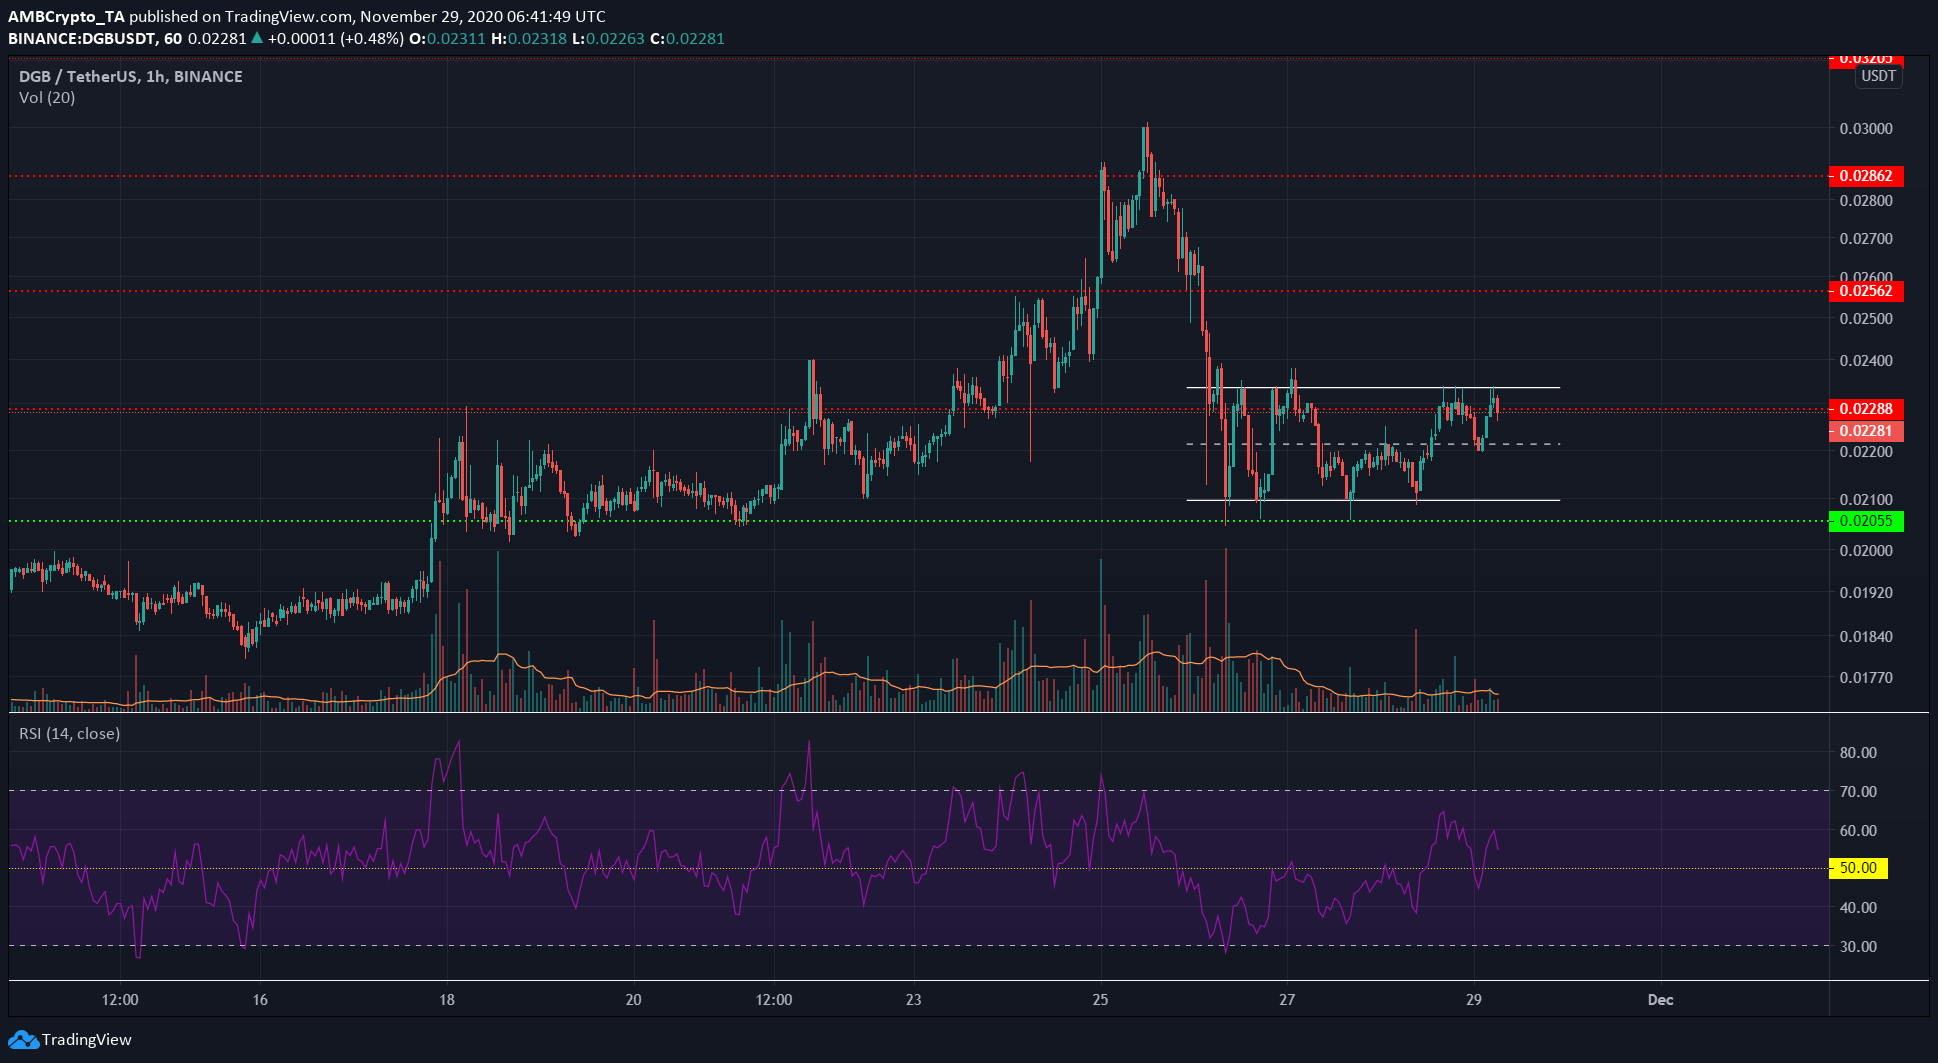
Source: DGB/USDT on TradingView
DigiByte was trading within a rectangle. Since the price descended into the pattern, it can be called a rectangle bottom, a pattern that generally sees an upward breakout.
Positive sentiment around altcoins, like in the previous week, could push DGB to break out to the upside once more. However, on the hourly charts, there was no sign yet of a move north.
The price was more likely to oscillate between the rectangle’s boundaries of $0.021 and $0.023. The RSI noted neutral momentum, with some short-term bullishness seen over the last few hours too.