Stellar Lumens was on its way to flip a level of resistance to support while moving higher on the charts, at the time of writing. On the contrary, DeFi tokens saw a surge after investors piled in on the first sign of strength and Aave doubled in value over the past few days. Finally, FTX Token hung on to its level of support as it looked to consolidate recent gains.
Stellar Lumens [XLM]
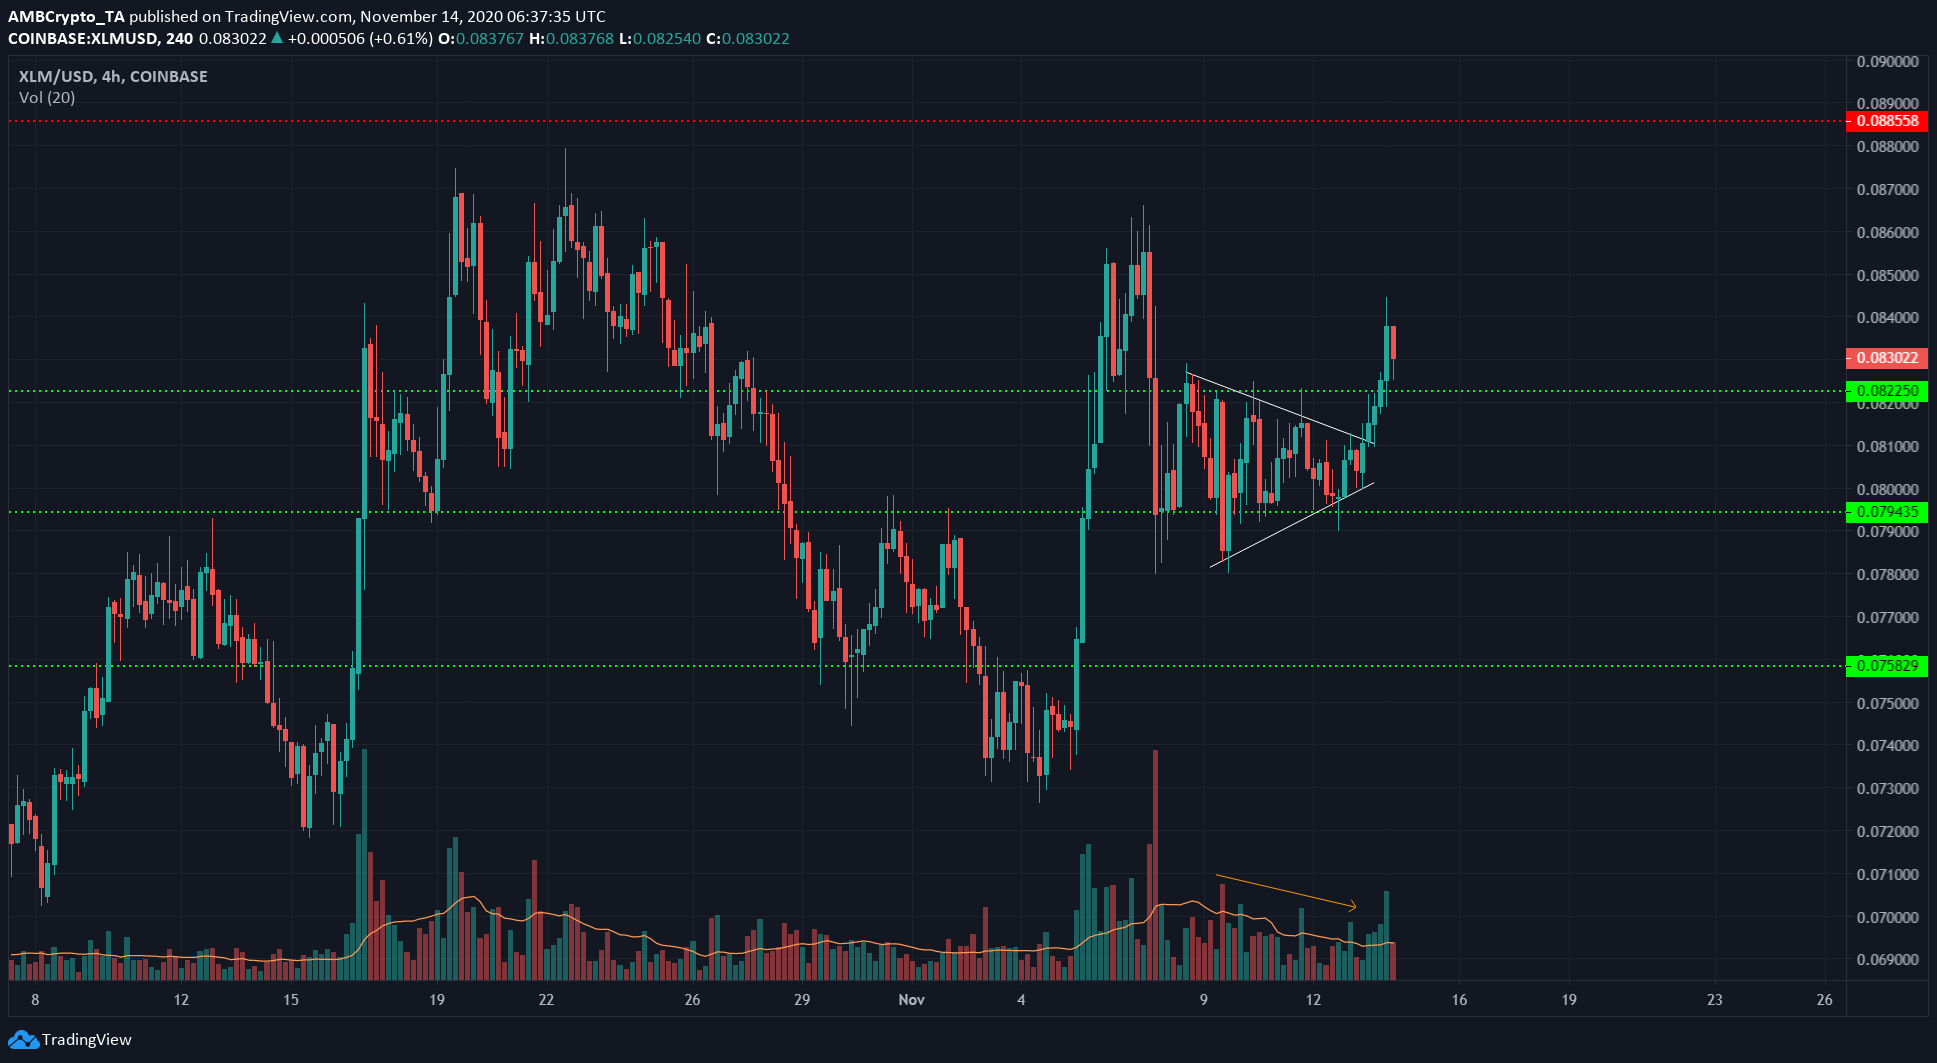
Source: XLM/USD on TradingView
Stellar Lumens formed a symmetrical triangle pattern (white), one that also exhibited a downtrend in trading volume while the price was within the pattern. Subsequently, it broke out to the upside, with a target at $0.085.
XLM did indeed register a wick upwards to $0.0845, showing that the pattern had indeed played itself out.
At the time of writing, the cryptocurrency’s price was pulling back to retest the support at $0.0822, confirming the level’s flip from resistance to support.
Aave [AAVE]

Source: AAVE/USDT on TradingView
AAVE had been on a strong uptrend, however, it did see a pullback to the support level at $51 after the RSI showed waning bullish momentum even as the price made higher highs.
The resistance at the $66.8-level proved too strong to overcome even on the second try. And yet, the market’s bulls can take heart in the fact that AAVE registered a higher low.
At the time of writing, the RSI showed that the momentum was still bullish for the crypto-asset. Important levels for the crypto-asset included the resistance at $66.8 and the support at $58.6.
FTX Token [FTT]
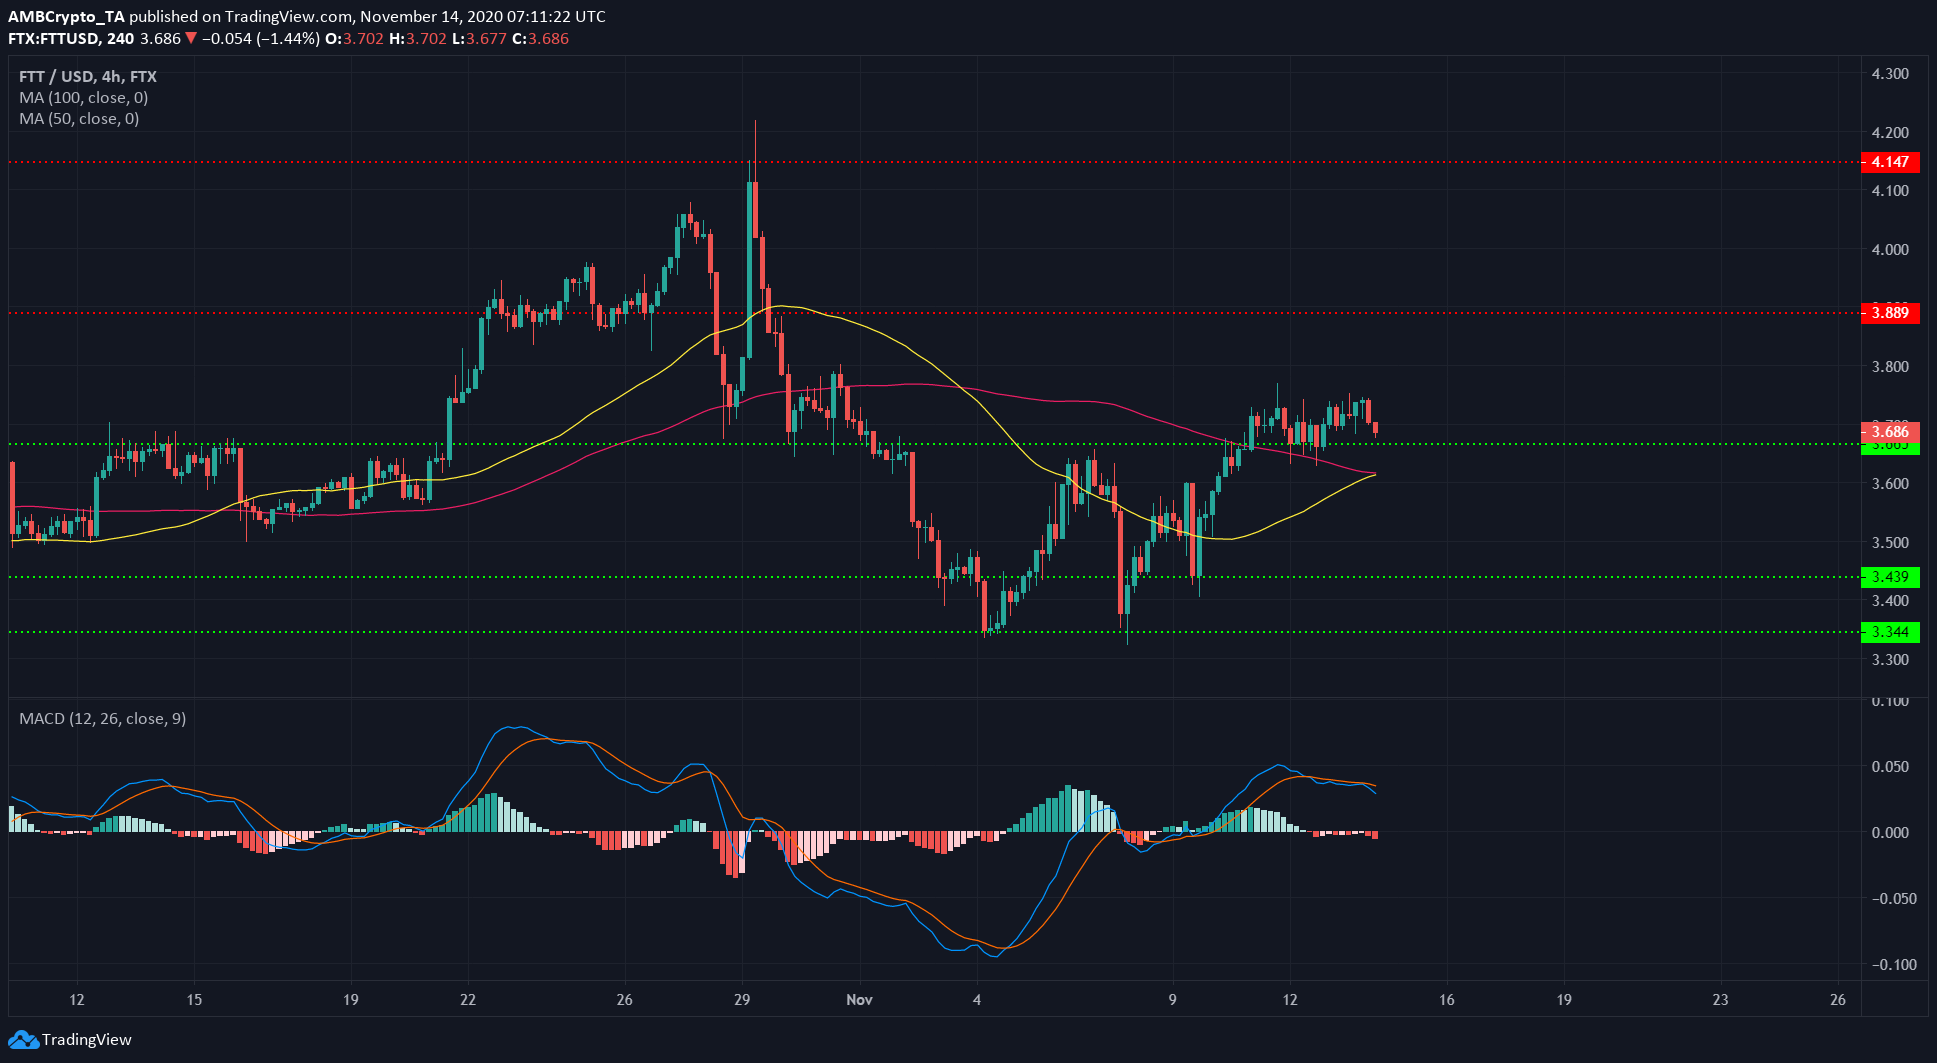
Source: FTT/USD on TradingView
FTT Token posted gains after a strong bounce off the support at $3.34. However, it saw its move upwards peter out at $3.77. Since then, it has traded just above the support at $3.66.
The 50 SMA (yellow) was on the verge of crossing to the upside of the 100 SMA (pink), while the price also recently broke to the upside of the 100 SMA.
This was bullish for the price but it remains to be seen if FTT can hold on to the level of support and move north once again. A close below $3.66 could take the price beneath its moving averages and reinforce bearish pressure on the crypto-asset.