- On 14th November, Litecoin’s daily transactions were more than double of Bitcoin’s transactions.
- Its native coin LTC, has, however, failed to see any significant growth since then.
The daily count of transactions completed on decentralized peer-to-peer network Litecoin [LTC] recently surpassed twice the transactions completed on the Bitcoin [BTC] network, according to on-chain data retrieved from Santiment.

Source: Santiment
On 14th November, Litecoin witnessed a daily transaction count of 1.01 million, representing its highest number since the blockchain network launched in 2011.
On the same day, the number of unique addresses involved in LTC transactions touched 1.16 million, logging a 46% uptick from the 794,000 daily active addresses recorded the previous day.
The surge in activity might be due to the recent growth in demand for Litecoin Ordinals.
In a post on X (formerly Twitter) made a day before the jump in network activity, Litecoin had noted that the network recorded 300,000 inscriptions in the past week.
More than 300,000 new #Ordinals have been inscribed on the Litecoin network in the last week. #LTC20 pic.twitter.com/SBIvJ4Q8df
— Litecoin (@litecoin) November 13, 2023
LTC fails to react
Despite the new highs recorded in network activity on Litecoin, its native token LTC failed to post any significant growth. Exchanging hands at $70.10 at press time, the coin’s price declined by 5% in the last week, data from CoinMarketCap showed.
The alt’s price has oscillated within a tight range since 5th November because of the steady growth in profit-taking activity.
LTC saw its value climb by double digits during the general market rally witnessed last month, and traders who now hold their coins above their cost basis have chosen to let go of their holdings.
An assessment of how profitable the day-to-day LTC transactions are showed that for every transaction that returns a loss, 1.16 transactions end in profit. The profitable nature of these transactions has spurred more coin holders to let go of the LTCs.
Portraying the waning demand for LTC, its Relative Strength Index (RSI) observed on a daily chart was 48.80, positioned below the center line. This showed that selling activity exceeded accumulation amongst LTC spot traders.
Is your portfolio green? Check out the LTC Profit Calculator
Likewise, the coin’s Money Flow Index (MFI) trended downward at press time, signaling a steady fall in buying momentum.
In addition, LTC’s on-balance volume (OBV) has declined by 7% in the last week. When an asset’s OBV falls in this manner, it suggests that there is weakening buying pressure or increasing selling pressure in the market.
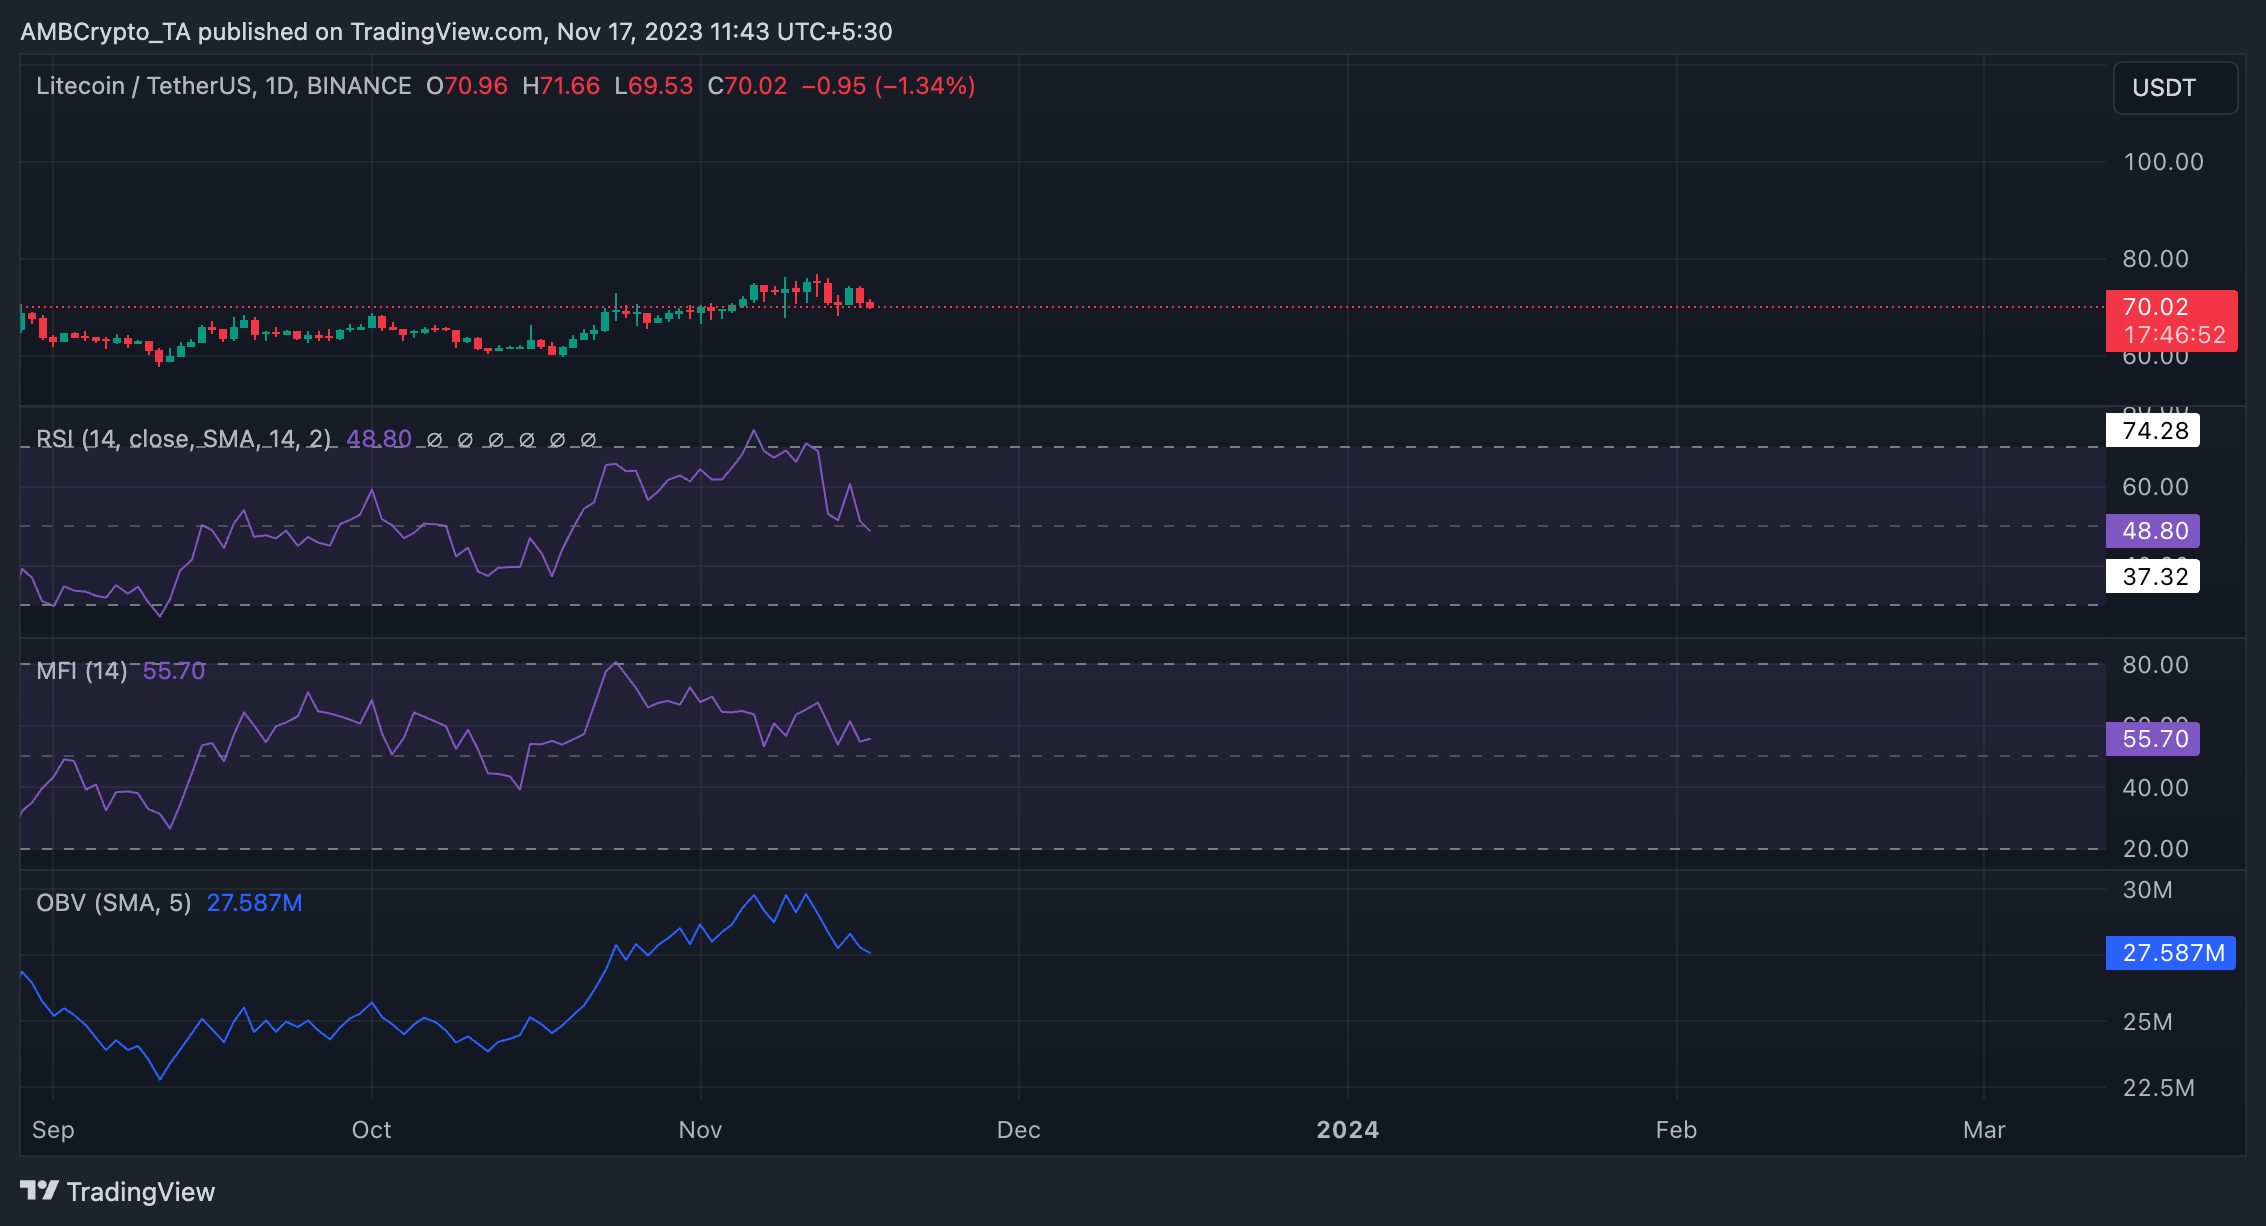
Source: LTC/USDT on TradingView
![Reasons why Litecoin [LTC] investors should be concerned](https://eng.ambcrypto.com/wp-content/uploads/2023/12/ambcrypto_A_Litecoin-themed_scen-400x240.png)