
The digital asset market’s collective bullish rally has continued over the past week, with Litecoin being one of the market’s top benefactors. At press time, the crypto-asset had managed to trump EOS to the 6th position on CoinMarketCap, with a market cap of $5.24 billion. Litecoin also registered a spike of 2.13 percent over the past 24 hours.
1-day chart
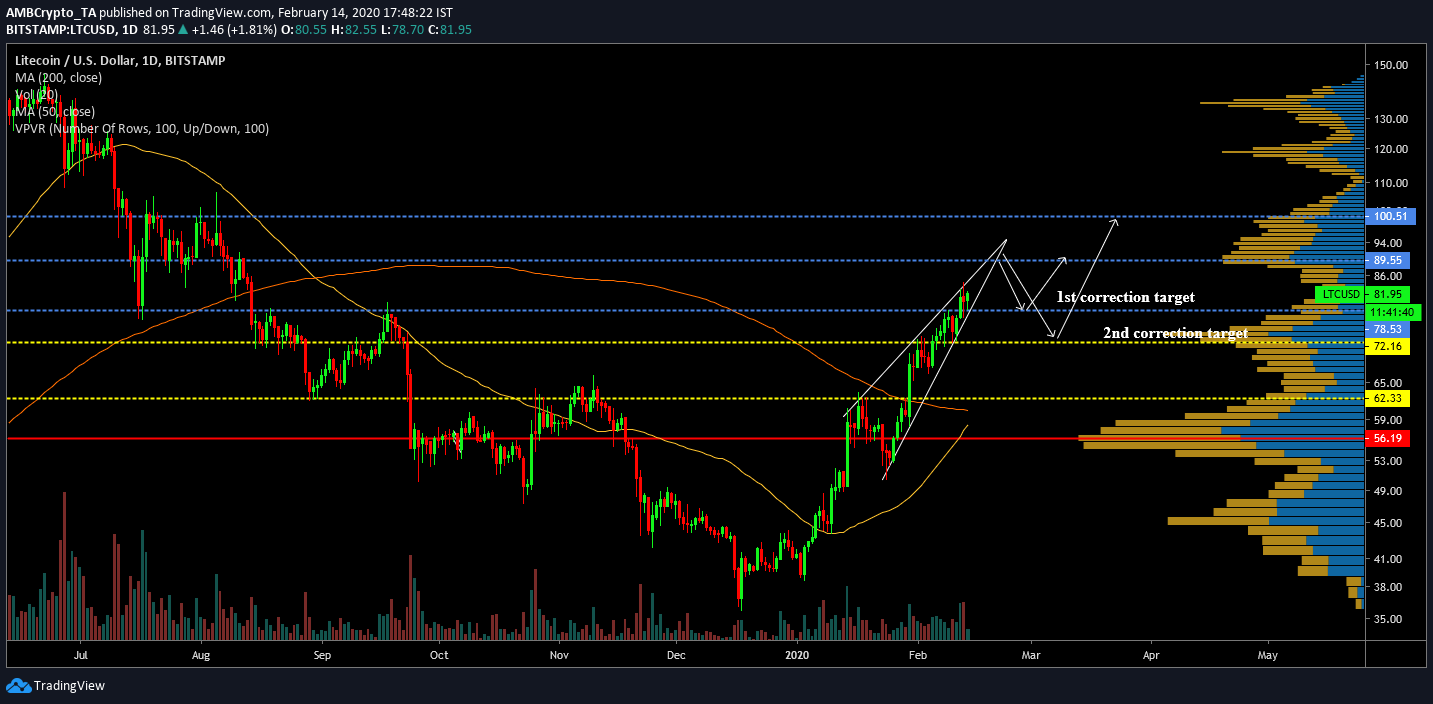
Source: LTC/USD on Trading View
The 1-day chart for Litecoin has been extremely bullish since the start of 2020 as the crypto-asset breached a major resistance at $62.33 and $72.16 within the first 40 days of the year. At press time, the price movement of Litecoin had given rise to the formation of a rising wedge. Here, it is important to note that over the past week, Litecoin did not register major corrections, a fact that may increase the possibility of a pullback over the next week. The formation of the above pattern inclines towards the same sentiment and a correction seems due for the LTC shortly.
On 12 February, Litecoin managed to surge past another resistance at $78.53, targeting the next resistance at $89.55. The chart highlighted that corrections may take either of the two paths in the market. A minor correction down to $78.52 is the 1st target zone for a retrace and bounce-back, after which the token should continue surging towards the resistance at $89.55. However, a pullback down to $72.16 held a higher probability. In hindsight, a correction down to $72.89 may trigger a substantial surge above $100 by mid-March.
According to the VPVR indicator, the trading volume has been significantly higher in the $72 range over the past month, forming a strong band of support at that position. Selling pressure could be countered with buying pressure at this range for a definite period.
The trading volume has also been decreasing on the charts, awaiting a reversal over the next week.
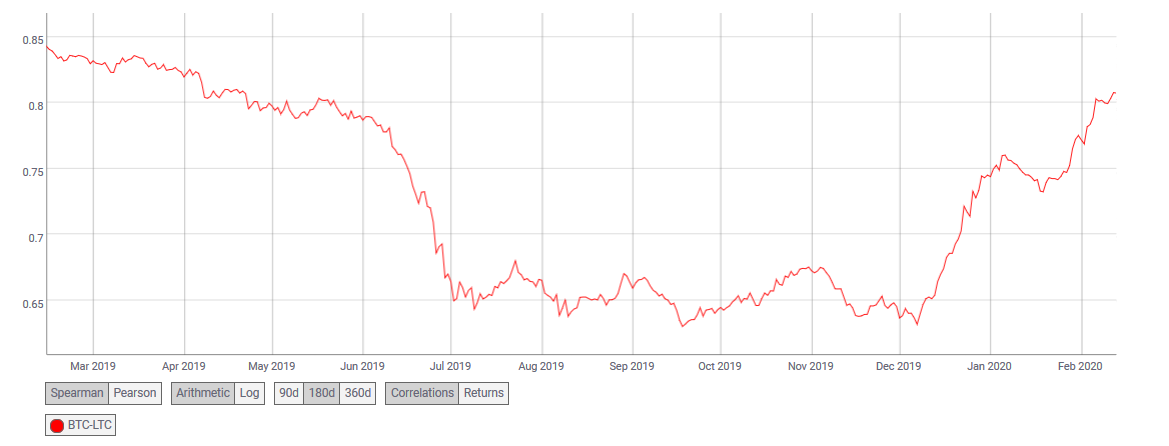
Source: Coinmetrics
However, Bitcoin’s movement on the chart may have a significant part to play in Litecoin’s future. The correlation index between Bitcoin and Litecoin was 0.807, at press time, a figure which was last observed in May 2019. Over that period, the industry was experiencing a bullish rally as well, with Litecoin surging over $100 by 15 May.
Conclusion
A minor correction down to $78 or a major slump to $72 should surface for Litecoin in the next two weeks. However, the apparent bullish momentum and Bitcoin’s movement may alter the future trend for the 6th largest crypto-asset.