Daily charts showed bearish momentum in the market, with some digital assets settling just above key support levels.
DASH and Stellar Lumens, ahead of a major downward move, were seen trading at their supports. While Litecoin, still waiting to claim its immediate support, might face an uncertain weekend in terms of its price action. High levels of bearishness were still visible for the digital asset on the daily charts.
Litecoin [LTC]
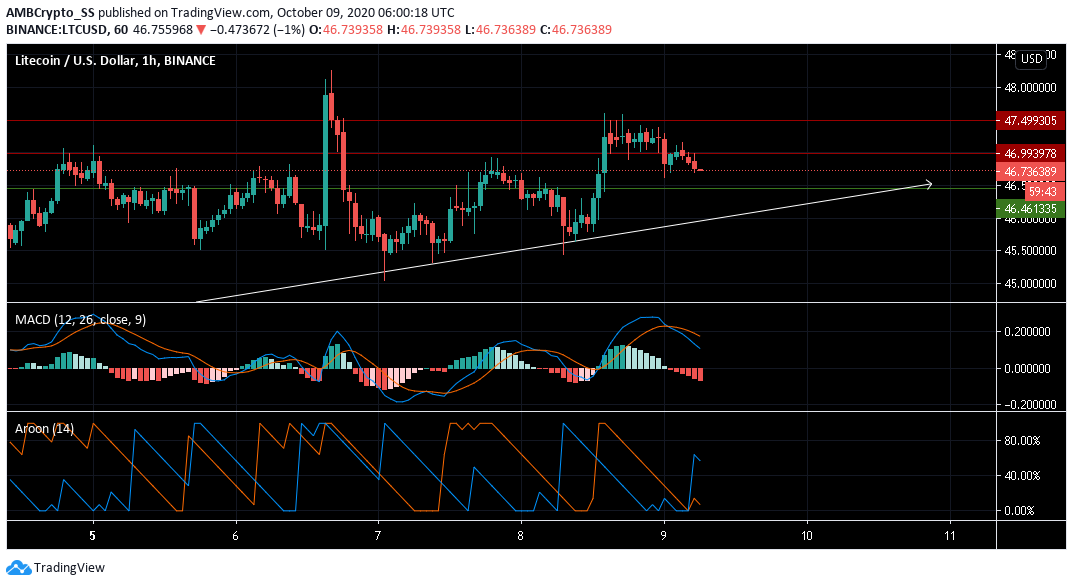
Source: LTC/USD on TradingView
Litecoin succumbed to a market-wide sell-off with a 3% move to the downside over the last 3 days. At press time, it was trading at $46.73
Aroon Indicator with Aroon Up (orange) below the Aroon Down (blue) continued to be bearish. MACD also seen making a bearish crossover, gave sell signals for the short term.
A bounce may be expected near its support at $46.46. Traders could attempt to ‘buy the dip’, however market momentum has picked up.
In other news, Litecoin has relaunched the MimbleWimble testnet (a privacy-enhancing protocol). This came in the backdrop of Europol, tightening its privacy regulations around digital assets.
Stellar Lumens [XLM]
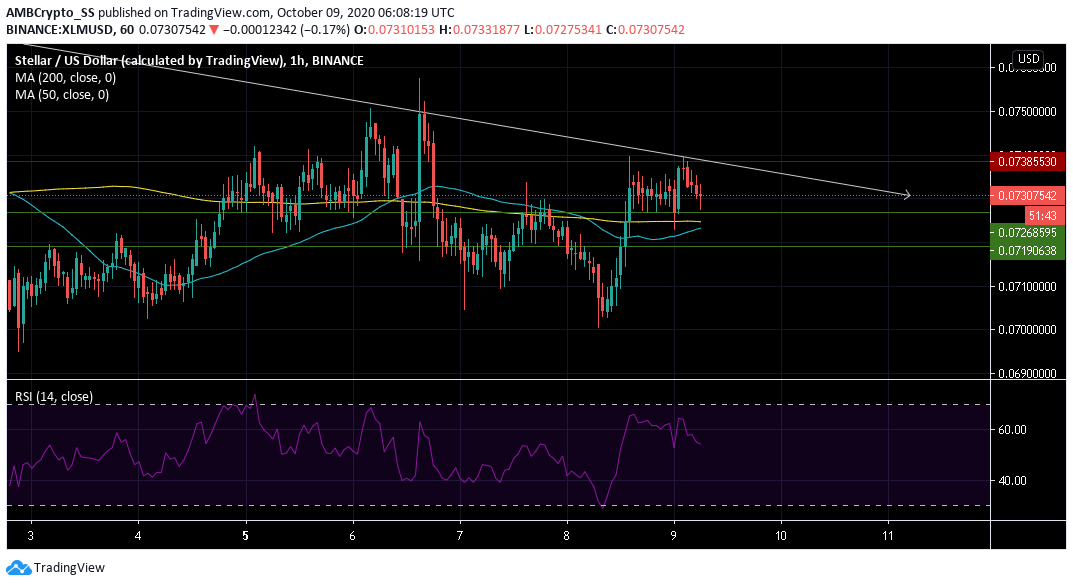
Source: XLM/USD on TradingView
The $0.0726 level remains a key area of support for Stellar Lumens. The price movement follows a rejection in the morning at the $ 0.0738 resistance.
However, despite sliding all the way down to $0.072, it hasn’t closed a daily candle below its 200 and 50 day moving average.
On the bright side, the daily 50 moving average (MA), might be heading for a golden cross. However, a weakness at the current support could stall such an event from happening and losses may continue.
The Relative Strength Index, highlighted the daunting possibility of a reversal. The RSI was seen diving below, indicating a fall in buying pressure.
Dash [DASH]
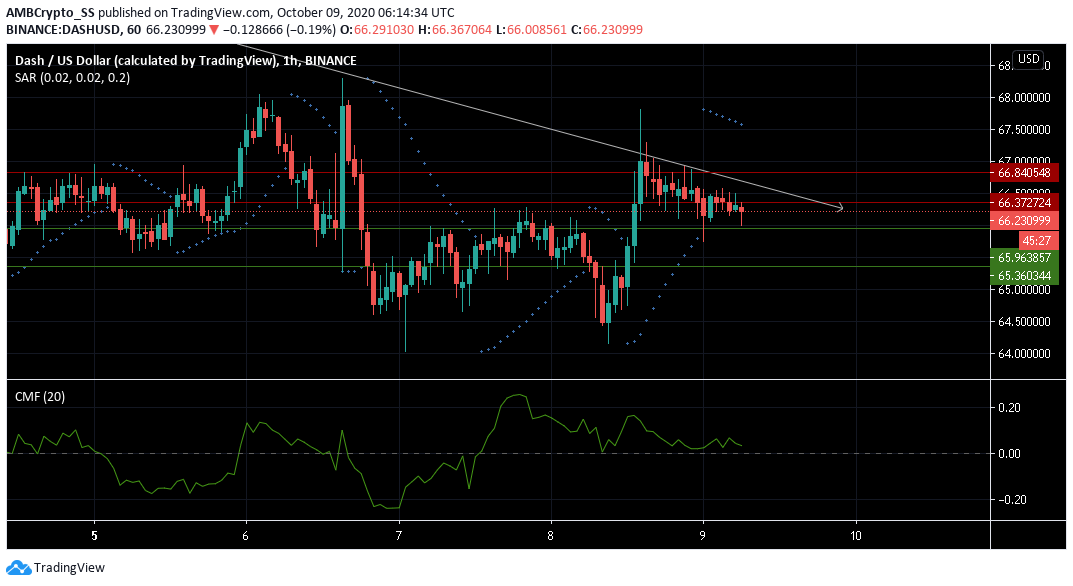
Source: DASH/USD on TradingView
DASH looks set for an upward move post its fall amidst an apparent descending channel pattern on the daily chart.
But investors must wait to see a re-test at the support of $ 65.96. The dotted lines of the Parabolic SAR above the candles still supported a downtrend.
Chaikin Money Flow Indicator remained neutral. However, hinting capital inflows still outnumbered the amount of capital outflows.
If a break down in price, over the next 24 hours, happens below its current support, initial possibilities of an upside could take much longer.
![Reasons why Litecoin [LTC] investors should be concerned](https://eng.ambcrypto.com/wp-content/uploads/2023/12/ambcrypto_A_Litecoin-themed_scen-400x240.png)