
Disclaimer: The following article is the sole opinion of the writer and should not be considered as investment advice
While the collapse on 1-2 October seemed brutal for most of the market’s crypto-assets, Litecoin has continued to maintain strong sideways movement between the ranges of $47.13 and $45. In fact, while LTC has breached its resistance level a couple of times, the cryptocurrency’s value has always dropped back below $47.13 after a few hours. With Litecoin’s charts pointing to another breakout at press time, the trend seemed to be red-hot for Litecoin. The question is – Is this going to be more range oscillation for LTC?
Litecoin 1-hour chart
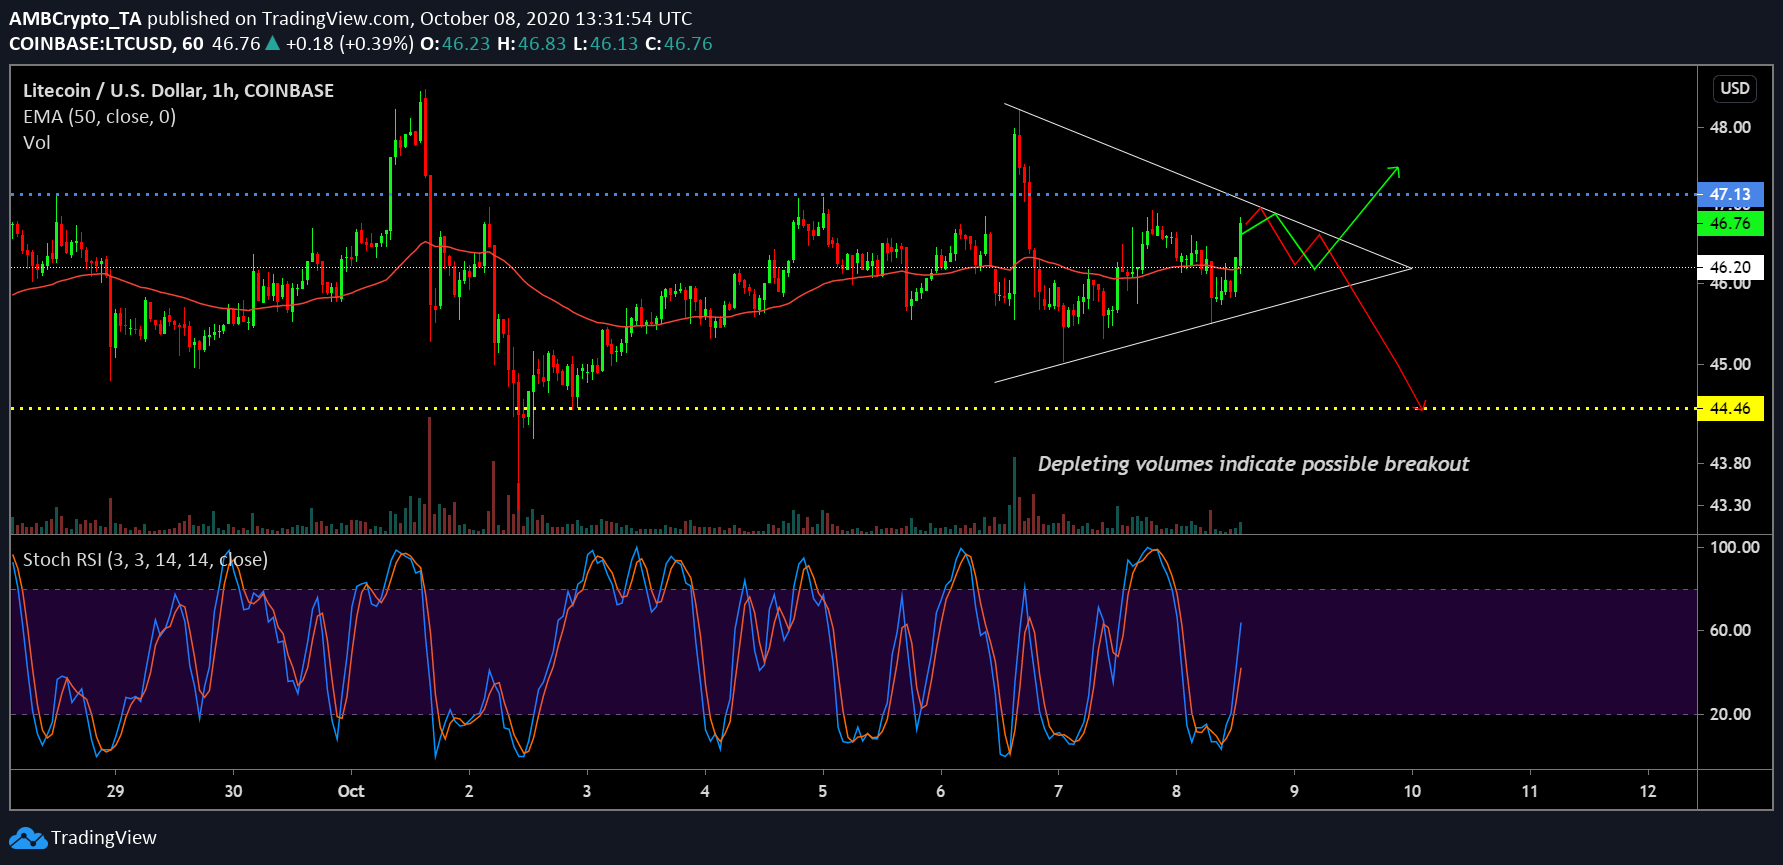
Source: LTC/USD on TradingView
Litecoin recently regained its position in the top ten after briefly falling down to 11th on the charts. Now, its position can improve further going forward as well. At press time, the crypto-asset had moved above the 50-Exponential Moving Average which is a very bullish sign. Another reason to believe that a breakout is imminent falls down to its symmetrical triangle formation.
While the pattern hadn’t registered strong lower highs yet, the press time candle breaking above the same might suggest that a bullish breakout might come after a short-term pullback at $46.20. The Stochastic RSI underlined the temporarily rising buying pressure, but the trading volumes also highlighted a strong reason.
In fact, over the past few hours, the price has been backed by low volumes, an observation which meant that the price at the press time range was not permanent. While the symmetrical triangle sways both ways in terms of being bullish and bearish, the narrative leans towards the bears a little bit more.
Litecoin 30-min chart
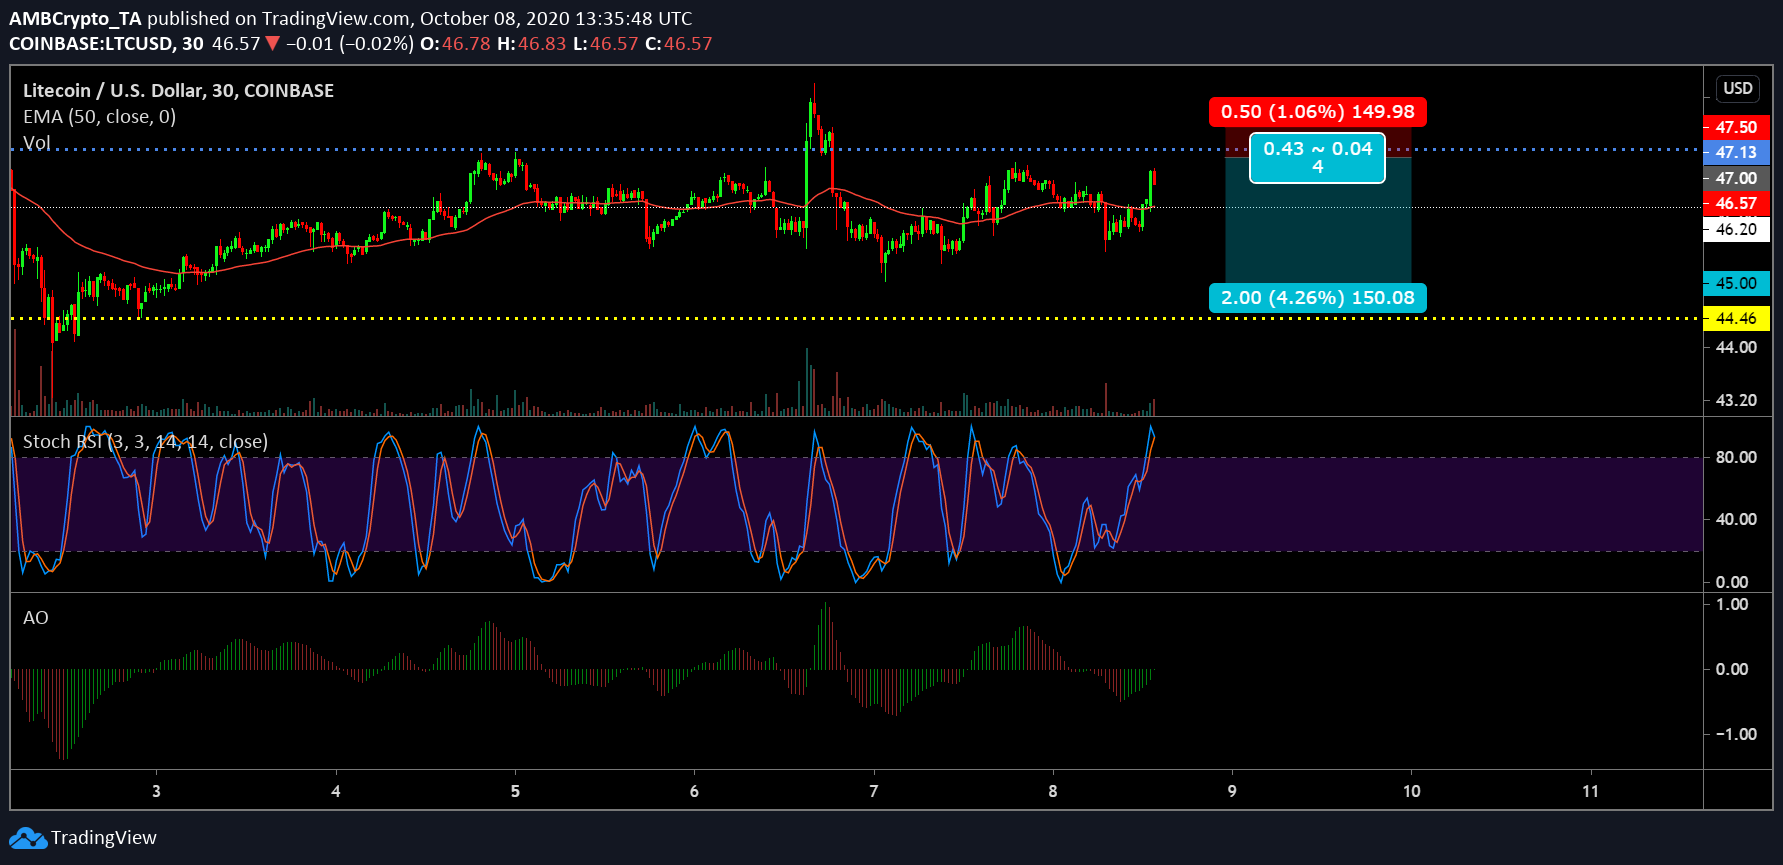
Source: LTC/USD on Trading View
As expected, on the 30-min chart, the Stochastic RSI was already at an overbought position where a pullback was on the cards. However, in light of minor surges taking place over the next few hours, a short-position can be entered at $47. Further, a close stop loss at $47.50 is preferable, while a stop-loss at $48 can be cost-effective as well. Profits can be taken at $45 as a drop would certainly take the price near the support at $44.46.
Finally, the Awesome Oscillator indicated the presence of bullish momentum at press time, but a reversal might be too near for the market’s 10th-ranked crypto asset.