The Crypto Fear and Greed Index was registering a figure of 90 at the time of writing, expressing a sentiment of extreme greed in the market. Litecoin and NEM reflected this bullish sentiment as they formed bullish patterns on their charts and found strong buyer interest behind their price rise. Verge, on the contrary, noted mounting bearish momentum in the near-term and could drop beneath its level of support.
Litecoin [LTC]
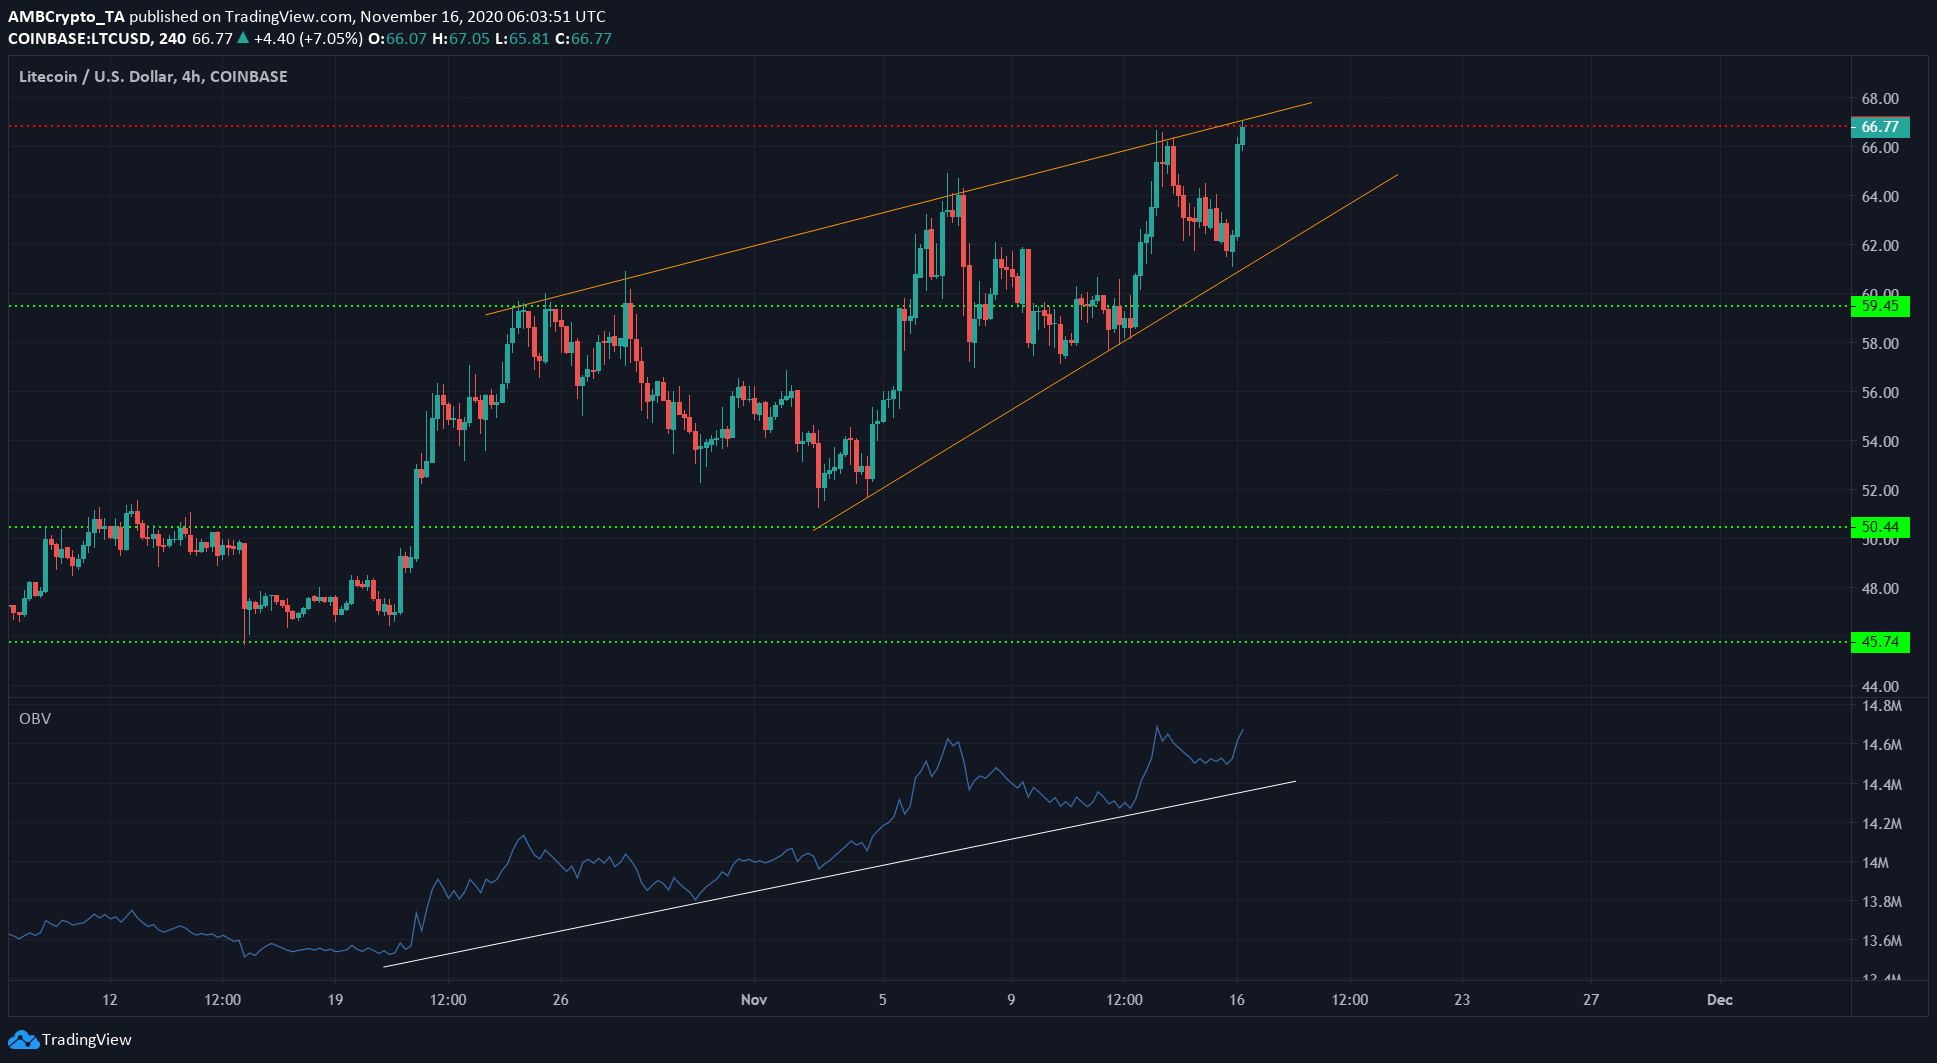
Source: LTC/USD on TradingView
Litecoin formed a rising wedge on the chart (orange). With a strong level of resistance at $66, it was likely that LTC would see a pullback to the support at $58, before another move upwards.
LTC was relatively quiet till late-October when it surged from $45 to $59. Since then, the crypto-asset has been strongly bullish. The OBV showed that there was good buying volume behind the price rise, giving legitimacy to the gains made.
A surge above the resistance level at $66, and a close above the pattern, would invalidate the rising wedge premise. In that case, it is possible that LTC would flip the resistance to support and move further north.
NEM [XEM]
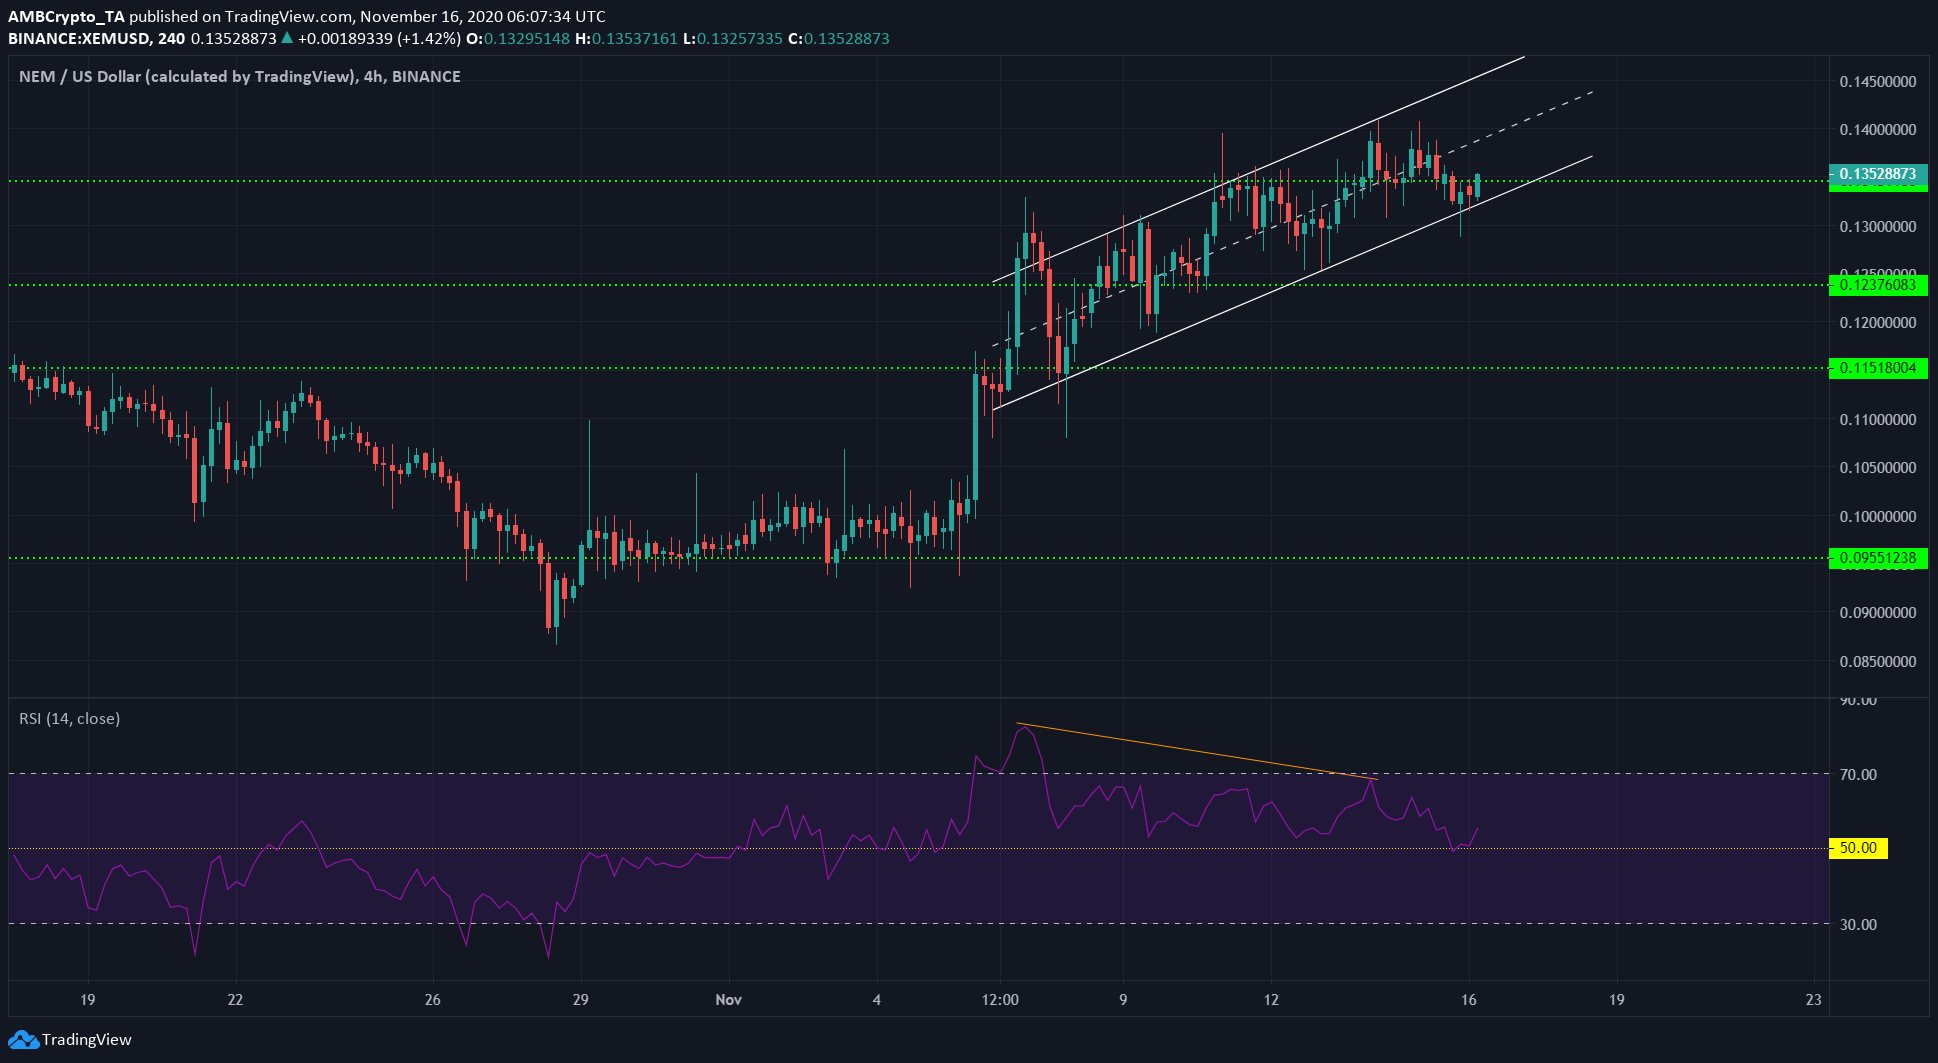
Source: XEM/USD on TradingView
XEM’s price was moving within an ascending channel (white). Highlighted on the charts was a bearish divergence that played out a few hours ago.
The price made higher highs as the momentum indicator (RSI) underlined waning bullish momentum. This accompanied a correction from $0.139 to $0.131, a 4.5% move.
However, the outlook for the crypto-asset was still bullish, at press time. It continued to register higher lows, and the RSI has stayed above 50 to denote an uptrend in progress.
Verge [XVG]
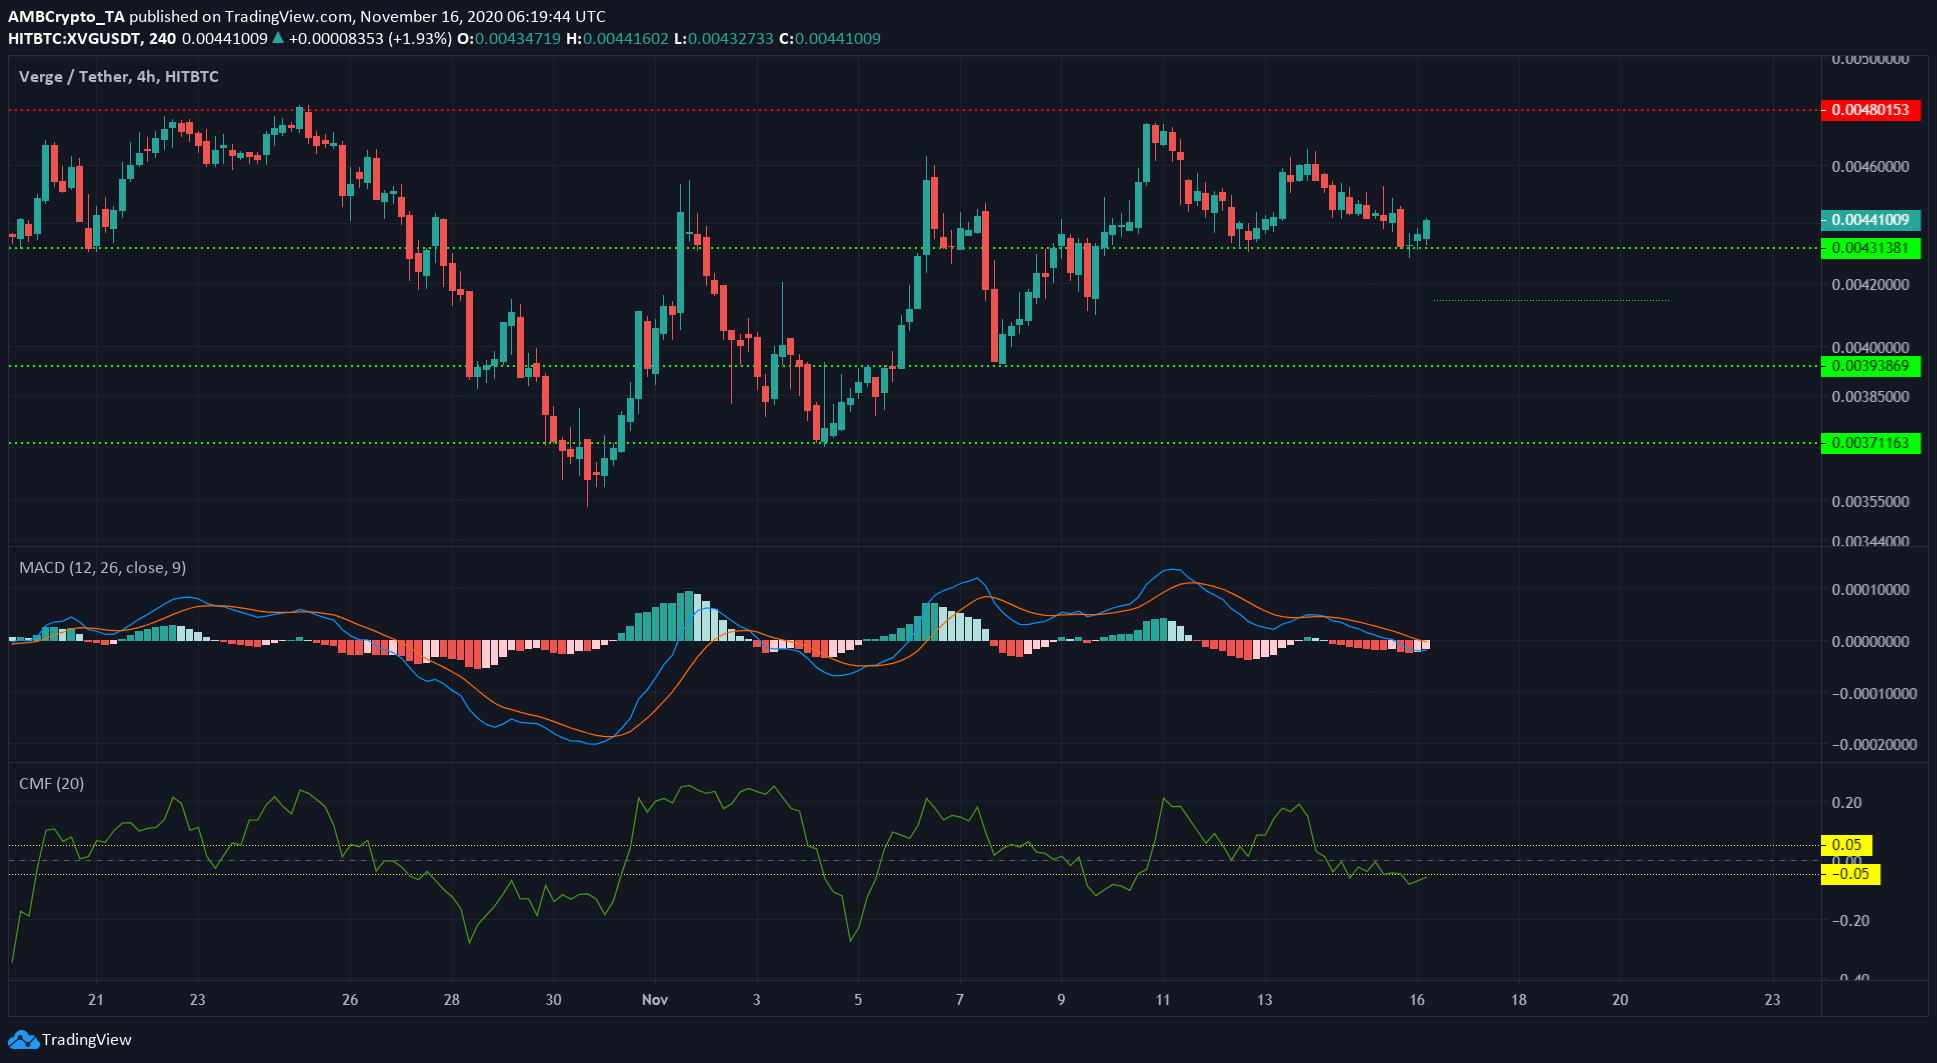
Source: XVG/USDT on TradingView
The resistance level at $0.0048 has stood since early September. Like many other altcoins, XVG also faced difficulty rising past a level of importance lost in the sharp drop in the first week of September.
In the short-term, the momentum appeared to have shifted toward the bearish side. The MACD formed a bearish crossover a few days ago, and at the time of writing, it was just under zero, pointing to a strong sell signal.
The CMF also showed that capital flows out of the markets were slowly rising and could overshadow the capital flows into the market. Ergo, it is possible that XGV might drop to the region of demand at $0.0042.
![Reasons why Litecoin [LTC] investors should be concerned](https://eng.ambcrypto.com/wp-content/uploads/2023/12/ambcrypto_A_Litecoin-themed_scen-400x240.png)