
Litecoin has seen a nearly 58% rise in value since the start of the year, moving back into the price range of its 2019 mid-November highs. Since August last year, LTC has been unable to cross the $78 mark, testing the resistance only once in the months that followed. However, Litecoin is likely to test this resistance once more, and this time maybe even break above it.
CoinMarketCap showed Litecoin with a market capitalization of over $3.6 billion, with nearly $3.4 billion worth of LTC traded over the last 24 hours.
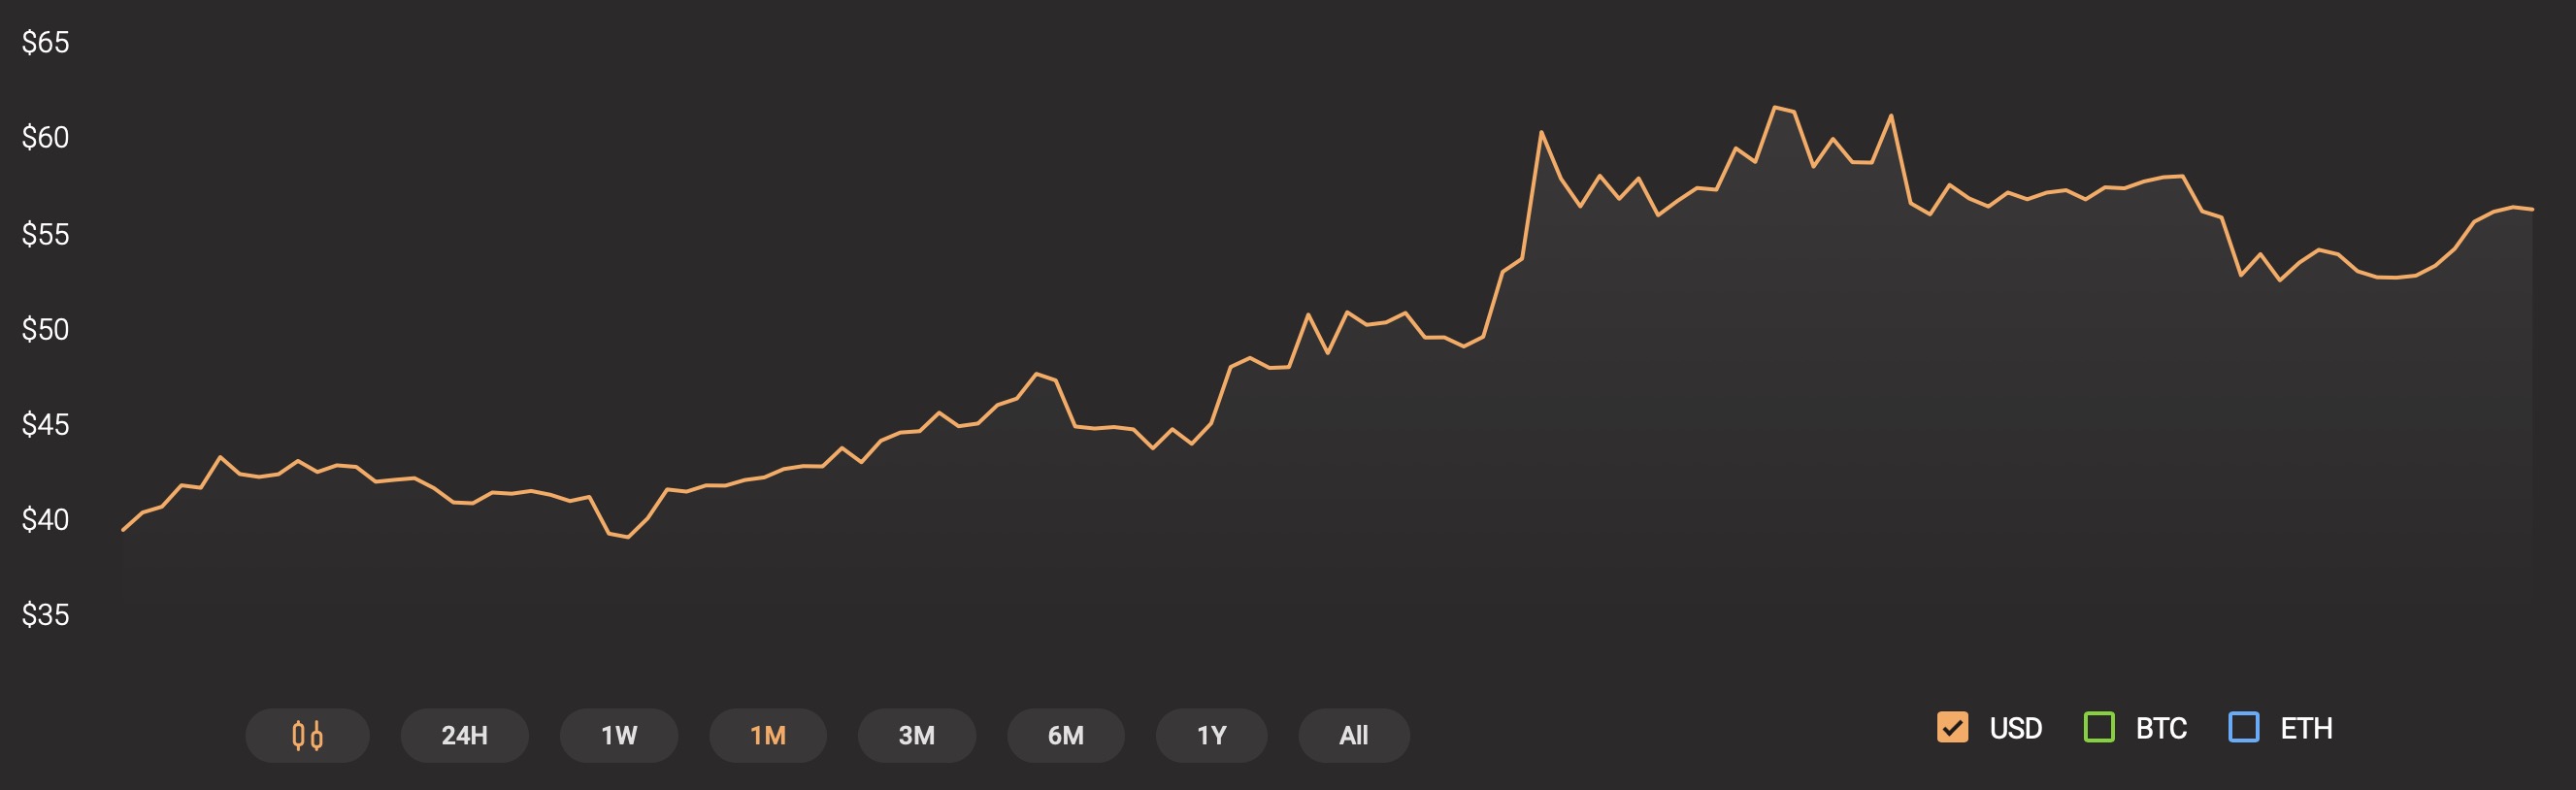
Source: CoinStats
Litecoin 1-day chart
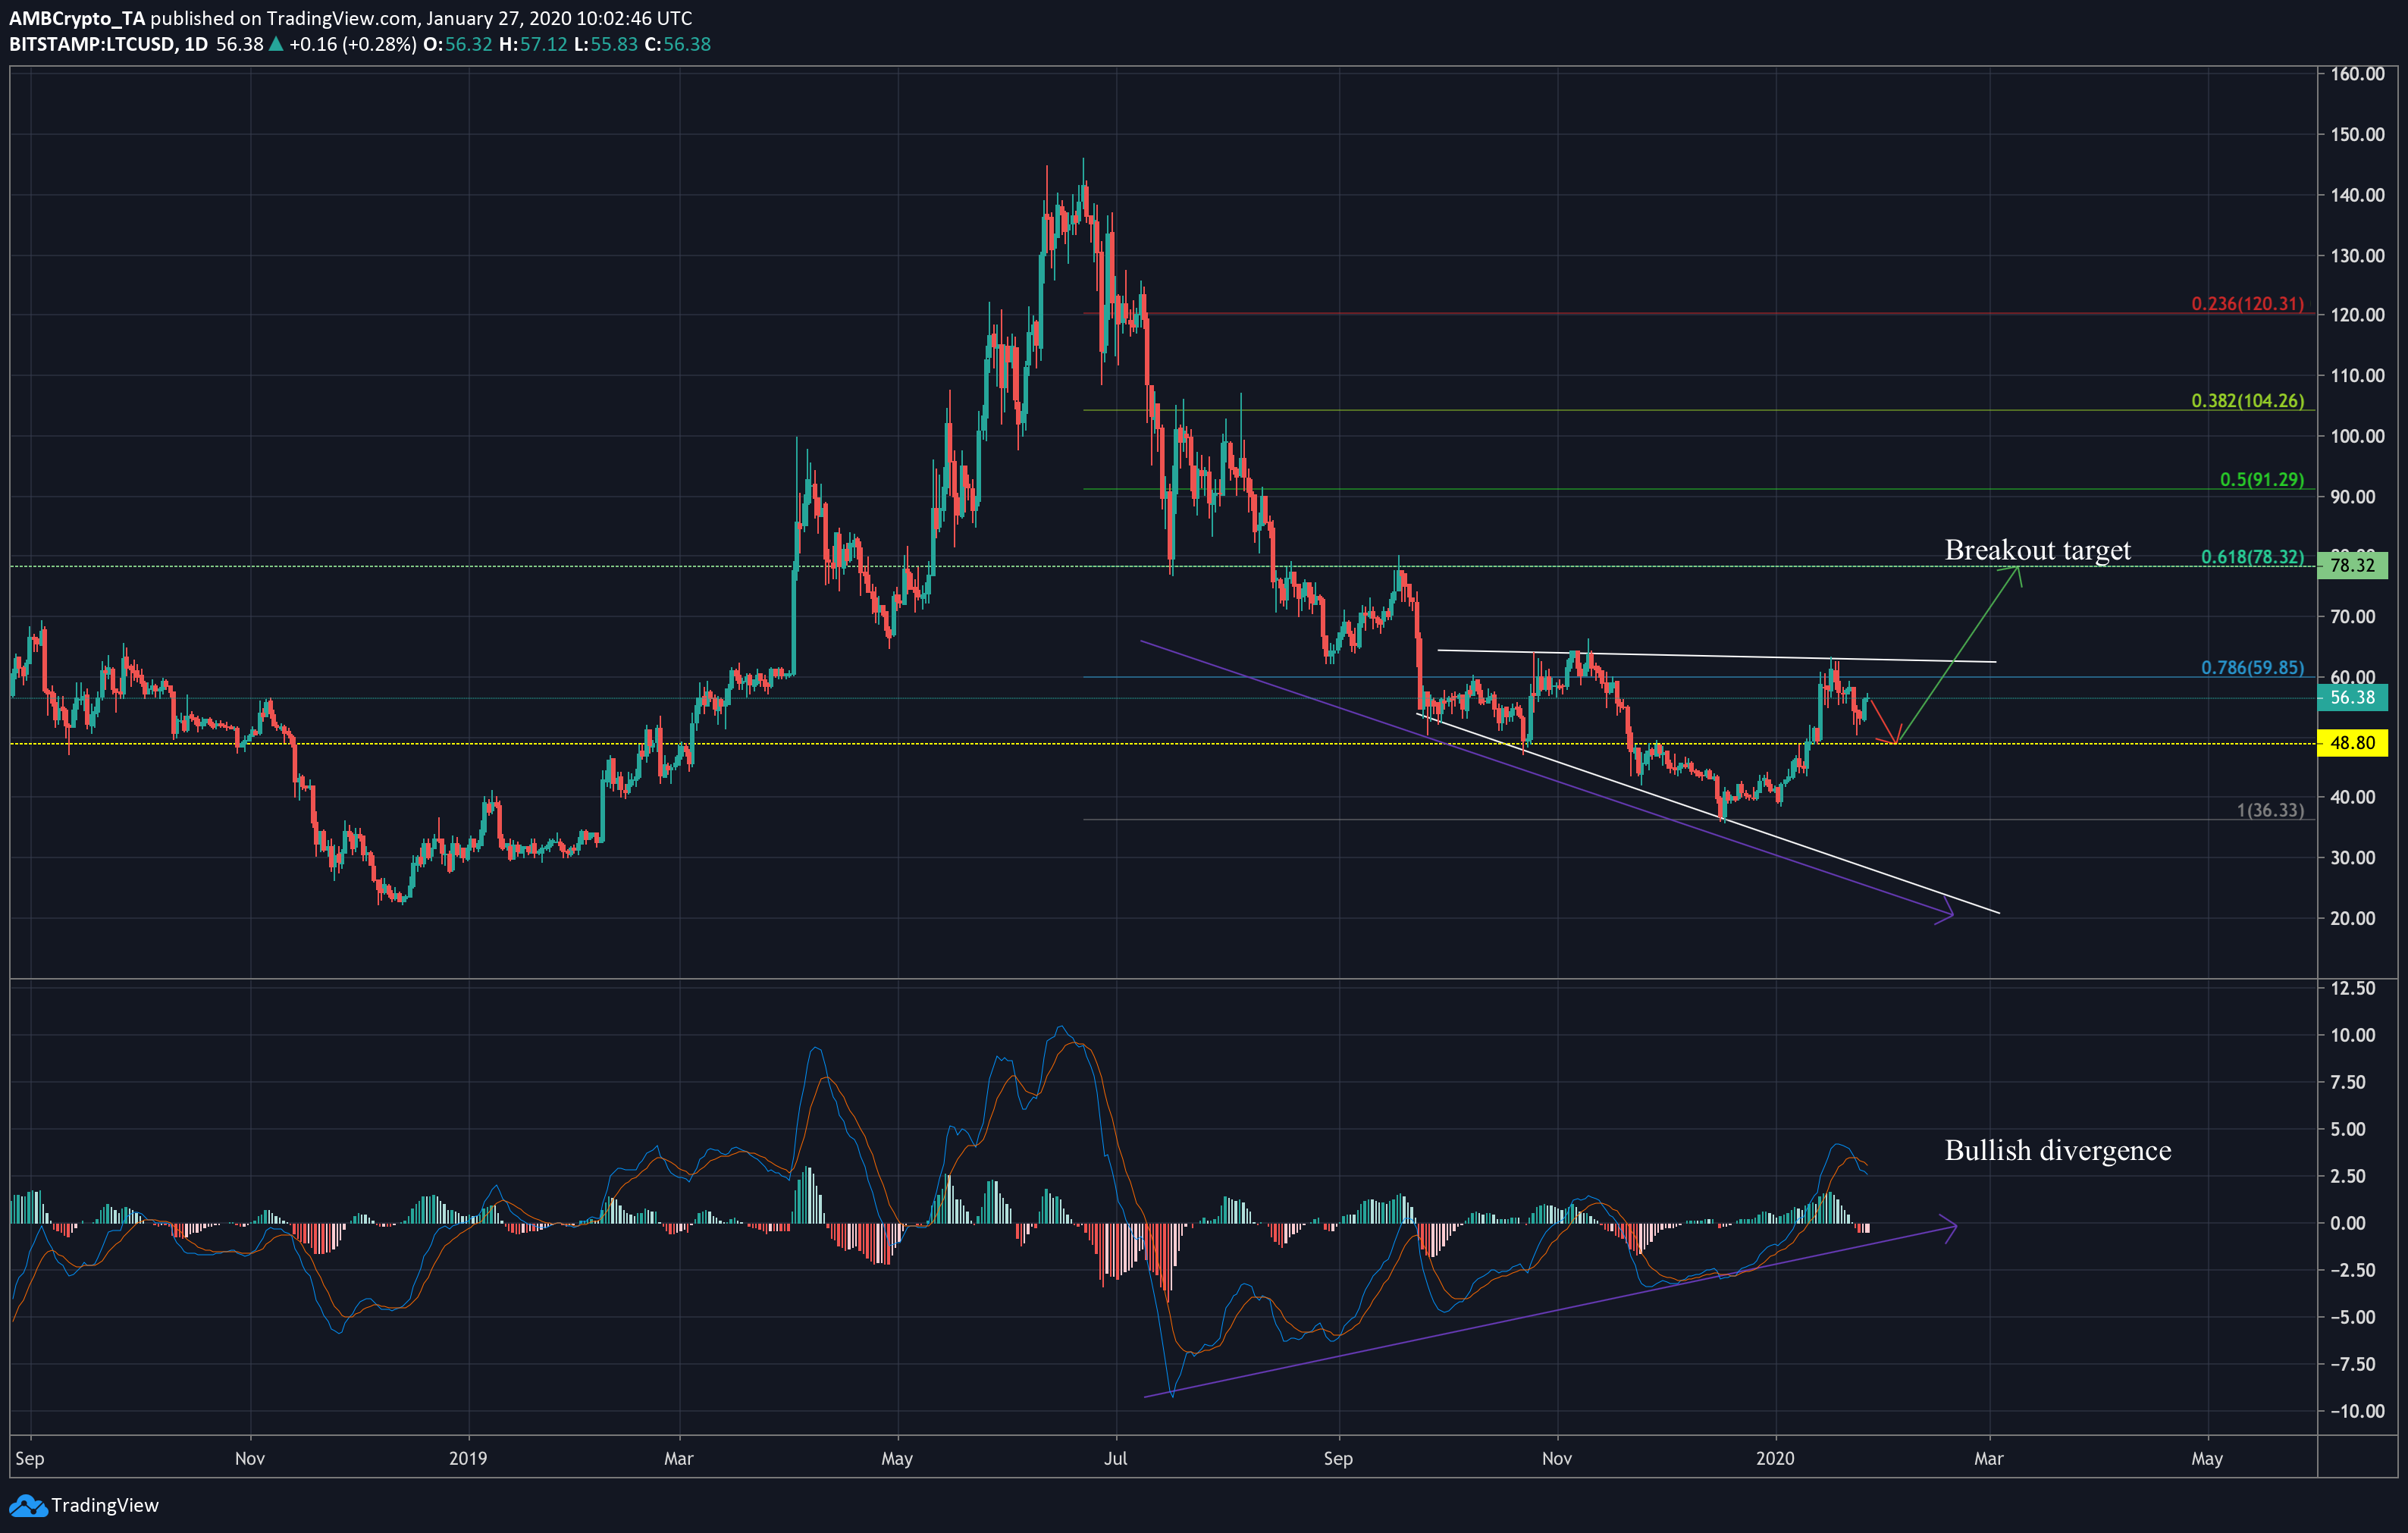
Source: LTCUSD on TradingView
Litecoin has been moving through a descending broadening wedge formation since late-September last year, alongside spikes in volume as the price neared the pattern boundaries. This pattern exhibits upward-facing breakouts in 80% of cases, making it more likely that LTC will move up in the near future. Also, the 50-day moving average could be seen moving under the price candles, which is generally considered an indicator of bullish short-term performance.
Ichimoku Clouds are a popular indicator used to determine an asset’s market performance by using moving averages to form cloud-like chart formations. When the cloud is green and under the price line, it can be an incredibly bullish signal. However, the above chart shows a red cloud under the price candles, followed by a green cloud slightly further down the line. This could mean that LTC will drop before rising to the breakout point. The 50-day moving average is also likely to act as a support during the brief movement downward.
MACD also indicated short-term bearish movement, signaling that a bearish cross-over had taken place. This further reinforces the idea that LTC could move down before breaking out above the pattern. Additionally, a bullish divergence was visible between MACD and LTC’s movements, which could mean a more long-term move upward in LTC value.
Spent Output Profit Ratio
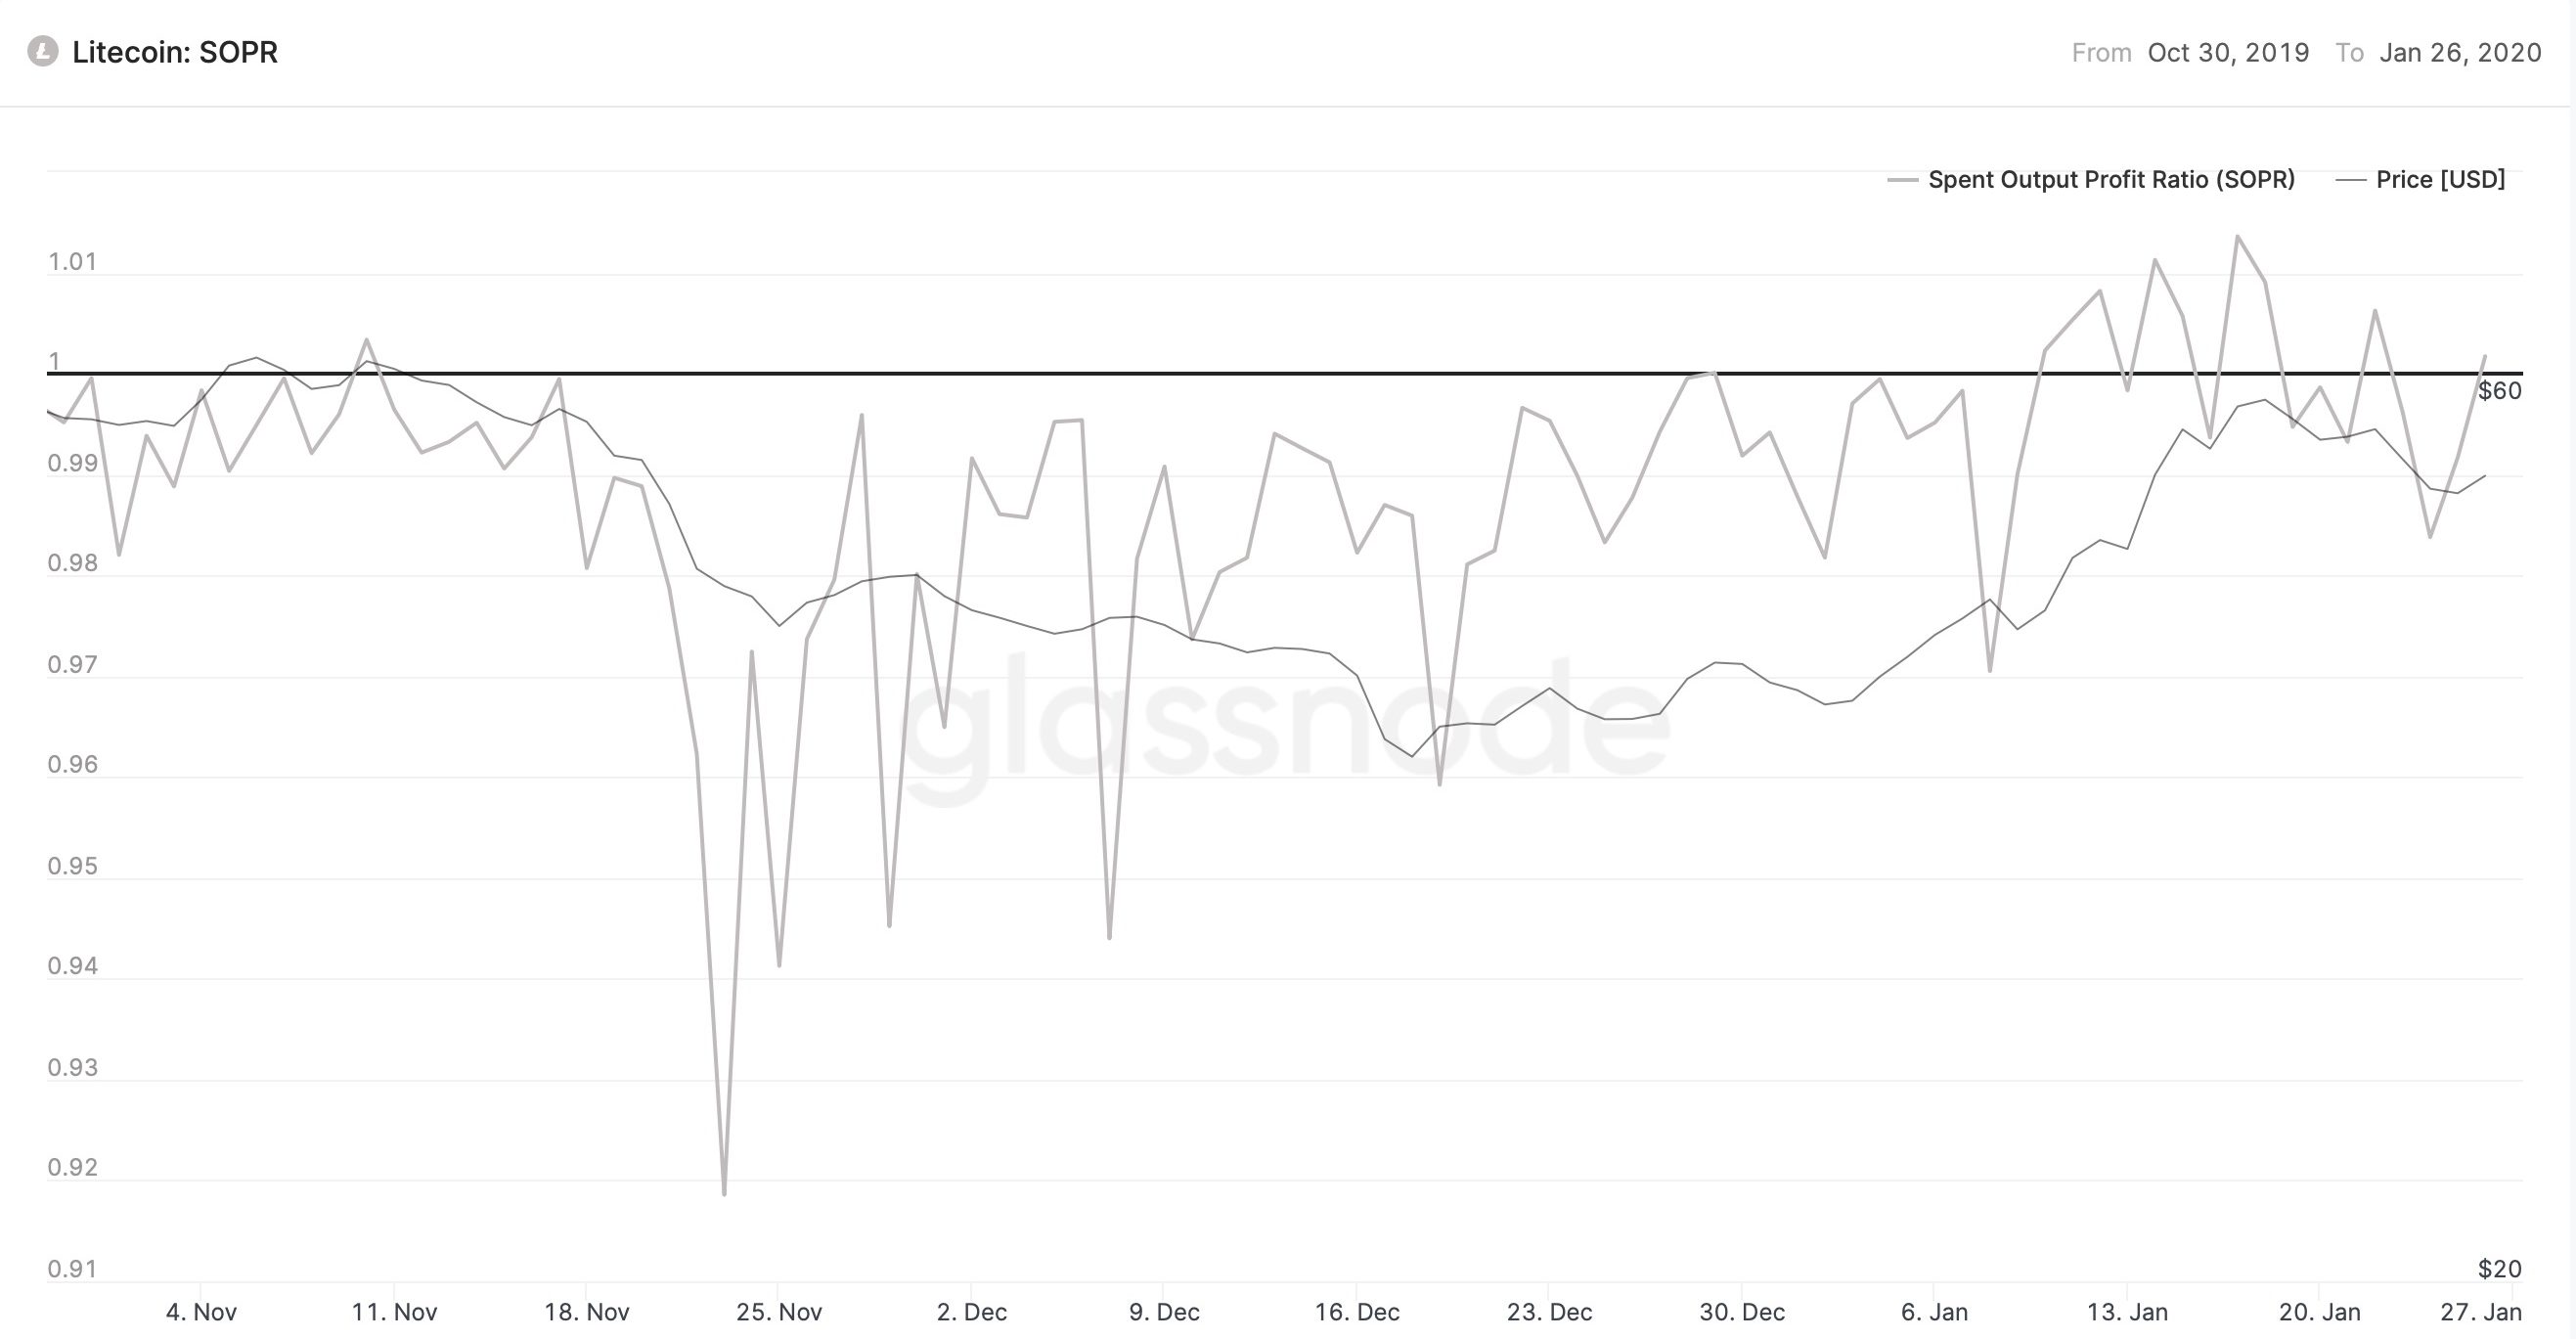
Source: Glassnode
Litecoin’s Spent Output Profit Ratio (SOPR) is a measure of how many spent LTC coins are in profit at the time of measurement. According to Glassnode, Litecoin’s SOPR has been rising since late-November and is above 1 at the time of writing. This means that the owners of the spent outputs are in profit at the time of the transaction and that the average investor is making gains. This, combined with the signals seen from the daily chart above, means Litecoin could be on its way up soon.
Conclusion
Litecoin could move down in value briefly before breaking above the broadening wedge formation around mid-February. This could push LTC down to $48.80 in the next two weeks. However, the bullish divergence indicated by RSI, the movement of the 50-day moving average and the positions of the Ichimoku Clouds could imply a bullish breakout to $78.32 in the weeks that follow.
![Reasons why Litecoin [LTC] investors should be concerned](https://eng.ambcrypto.com/wp-content/uploads/2023/12/ambcrypto_A_Litecoin-themed_scen-400x240.png)