
As has been the case with almost all cryptocurrencies so far this year, Litecoin has made substantial gains over the last five weeks. Sporting a price tag of around $74 at the time of writing, Litecoin has a market capitalization of $4.72 billion according to CoinMarketCap.
Litecoin 1-day chart
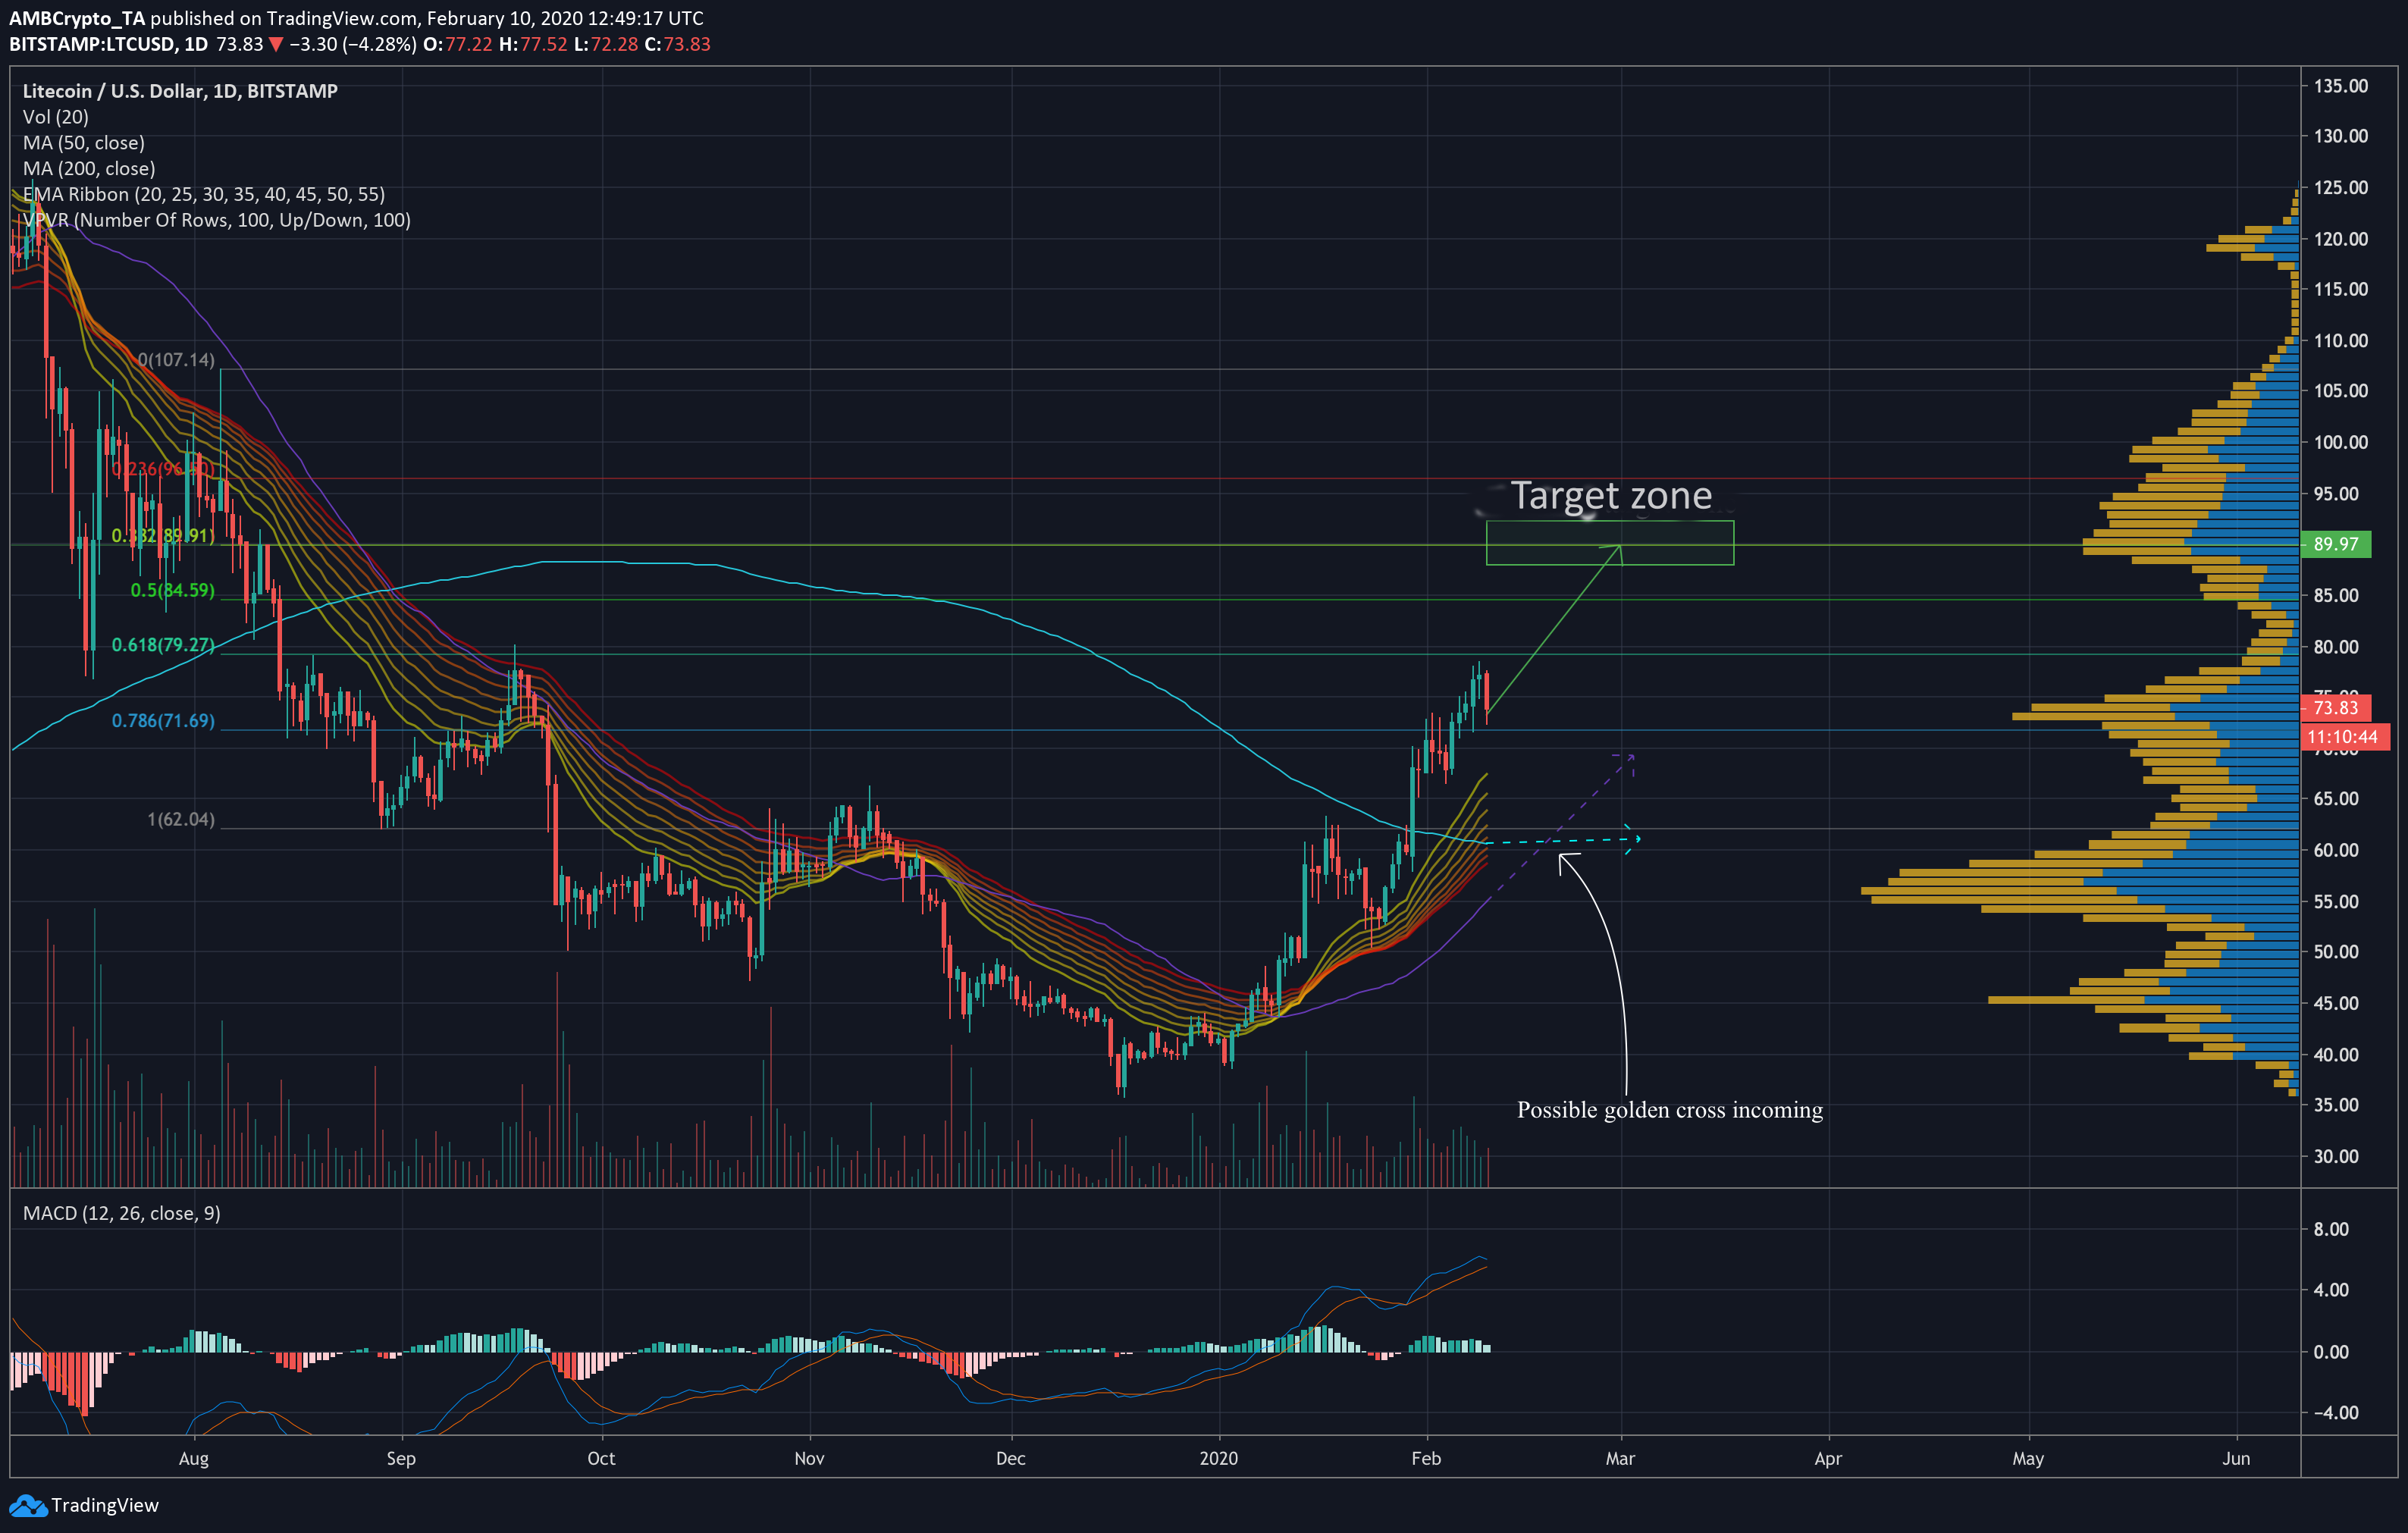
Source: LTCUSD on TradingView
At its current value, Litecoin has seen over 90% gains since the start of the year. In just over two weeks from January 1, LTC rose by nearly 64%, followed by a brief 20% correction downward over the next week. The pump that came next pushed Litecoin to a new five-month high, where it was testing the 78.6% Fibonacci retracement line support at the time of writing.
The 50-day moving average was seen moving well under the price candles, as was the 200-DMA. While the positions of both MAs predict bullish movements to come, it should be noted they are still influenced by the death cross from late-August. However, if Litecoin continues to move upward, the two MAs could form a golden cross as they adapt to the rising price, which is usually a strong sign of long-term upward price-movement.
The MACD indicator also looked to be predicting a bullish move in the weeks to come, and though the MACD line’s slight dip down could be cause for concern, it is likely due to the corrective movement made by the latest candle. Since the price will probably face bullish pressure at this support, a rise in value can be expected.
Additionally, the EMA Ribbon lines were moving under the price, and its individual lines looked to be diverging. This is generally a good sign, though since the lines have been diverging for some time now, a mean reversion could come into the picture. While this won’t necessarily facilitate downward price movement, it could hinder price action once it occurs.
LTC is likely to bounce from the 78.6% Fibonacci retracement line in the near future, and a golden cross formation could mean it will shoot up to the 38.2% retracement line at the next high-volume node on the volume profile. This sets a target of $90 by the first week of March.
Volatility
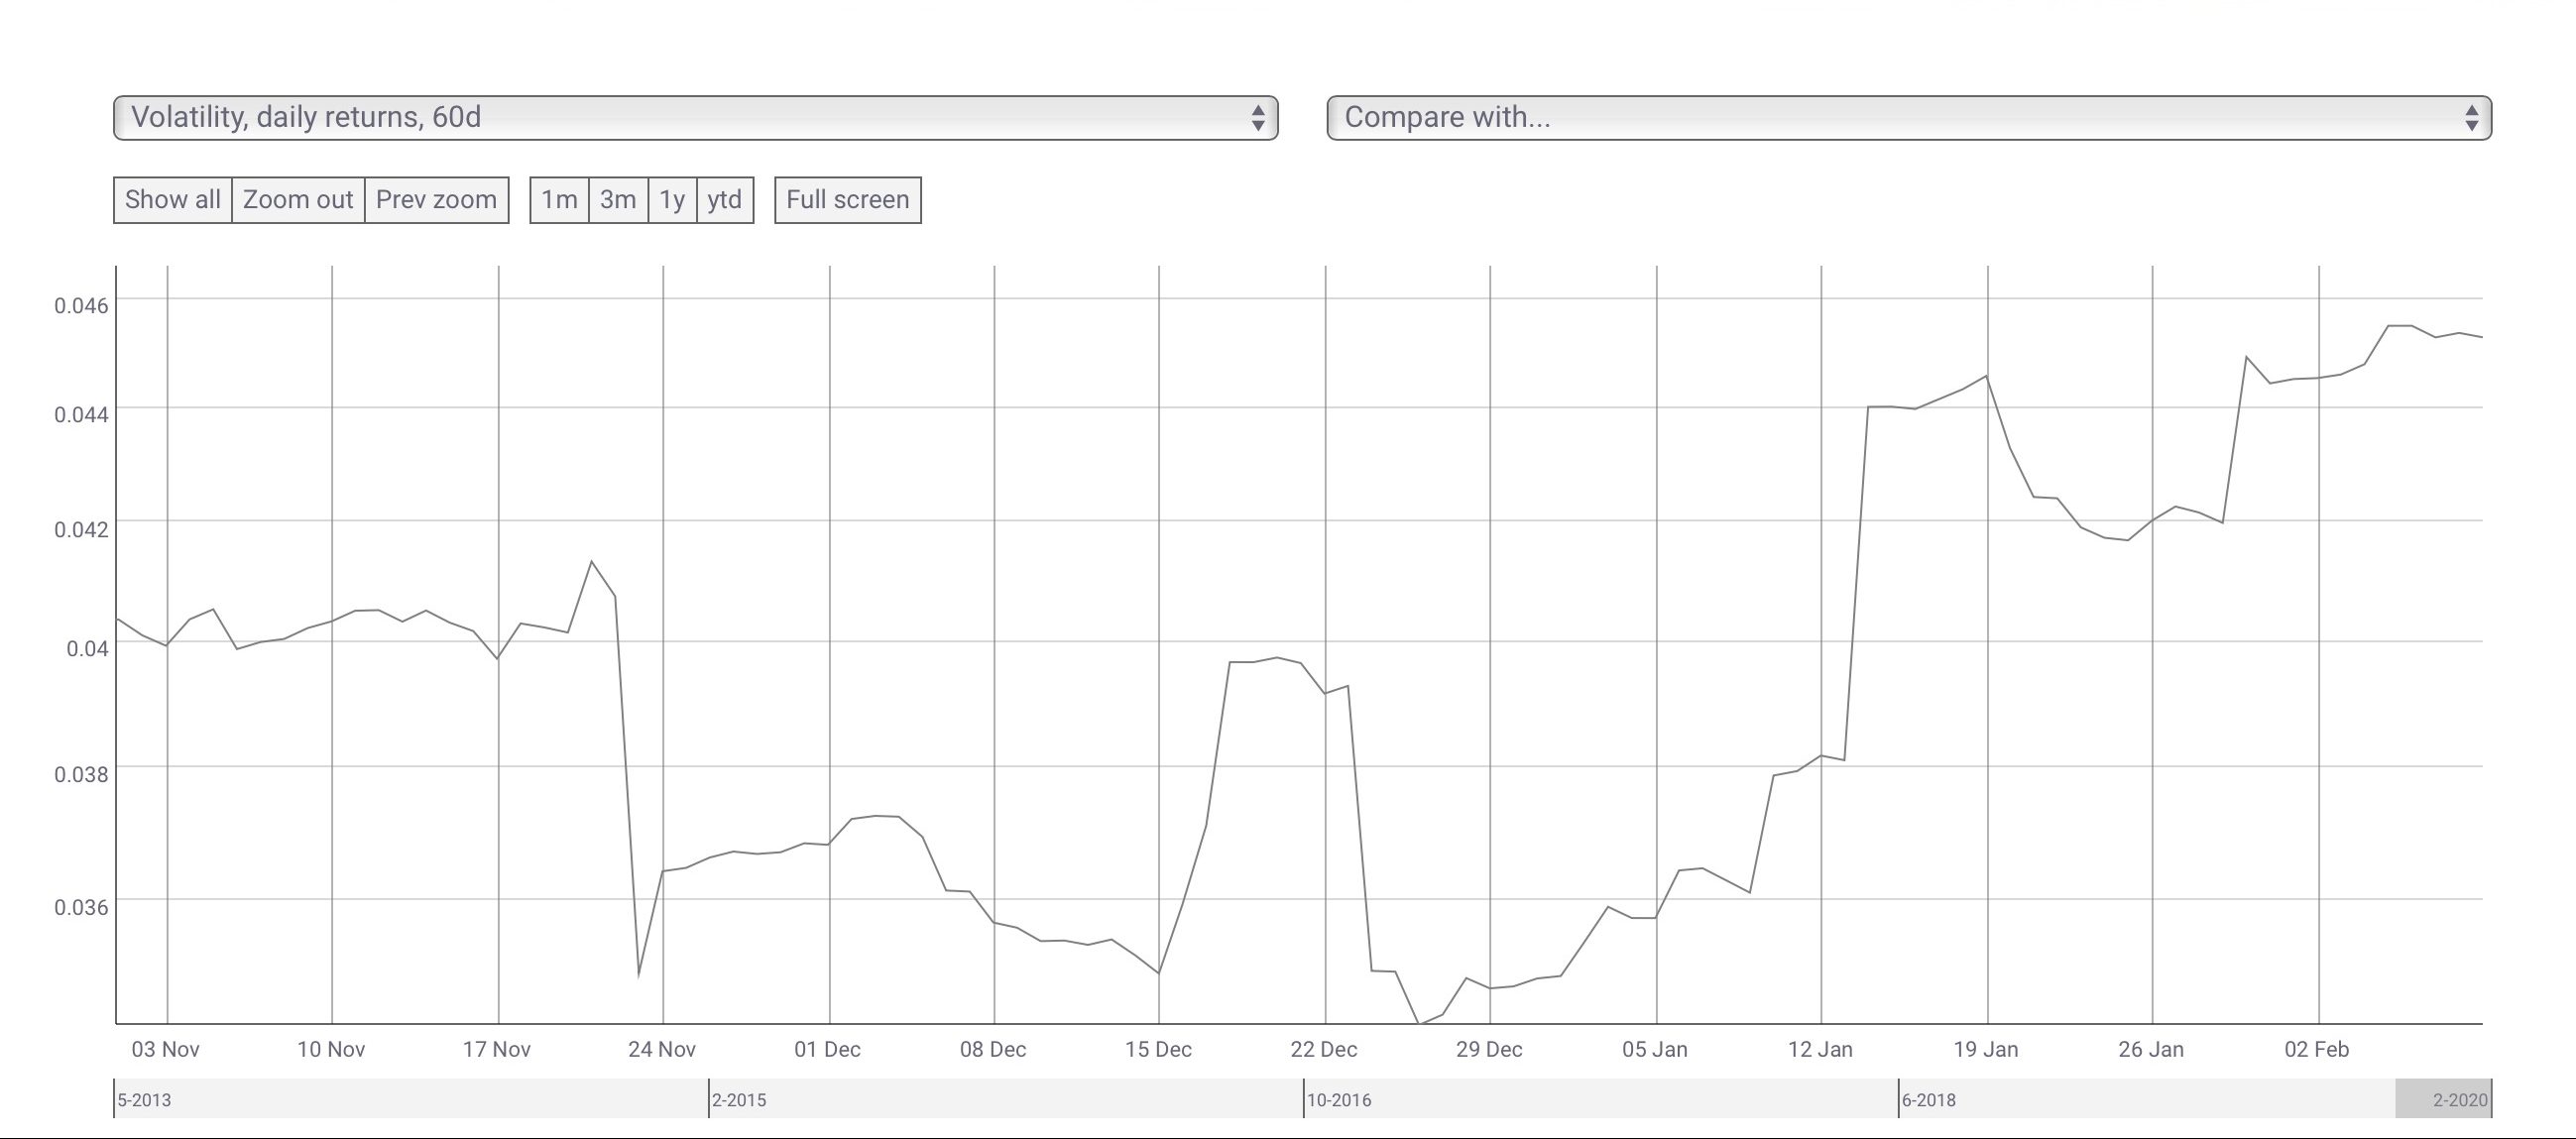
Source: CoinMetrics
Data from CoinMetrics shows Litecoin 60-day volatility has been on the rise since 2020 began and is currently as high as mid-September levels. The last time volatility was near this high was on January 19, which caused a drop in LTC value. However, volatility works both ways, so Litecoin could indeed push up as mentioned above.
Conclusion
If Litecoin is able to bounce back up from the support at $74, the 50 and 200-day moving averages could create a golden cross as they catch up to the rising price. With increased volatility in recent times, Litecoin could see itself around the $90 mark by the first week of March.
![Reasons why Litecoin [LTC] investors should be concerned](https://eng.ambcrypto.com/wp-content/uploads/2023/12/ambcrypto_A_Litecoin-themed_scen-400x240.png)