
Since touching its 2019 high above $145 in June, Litecoin is down around 65% with a value of $50 at the time of writing. LTC market capitalization has, however, been on the rise since mid-December, and a deeper look showed Litecoin might continue moving on the upward path.
Litecoin 1-day chart
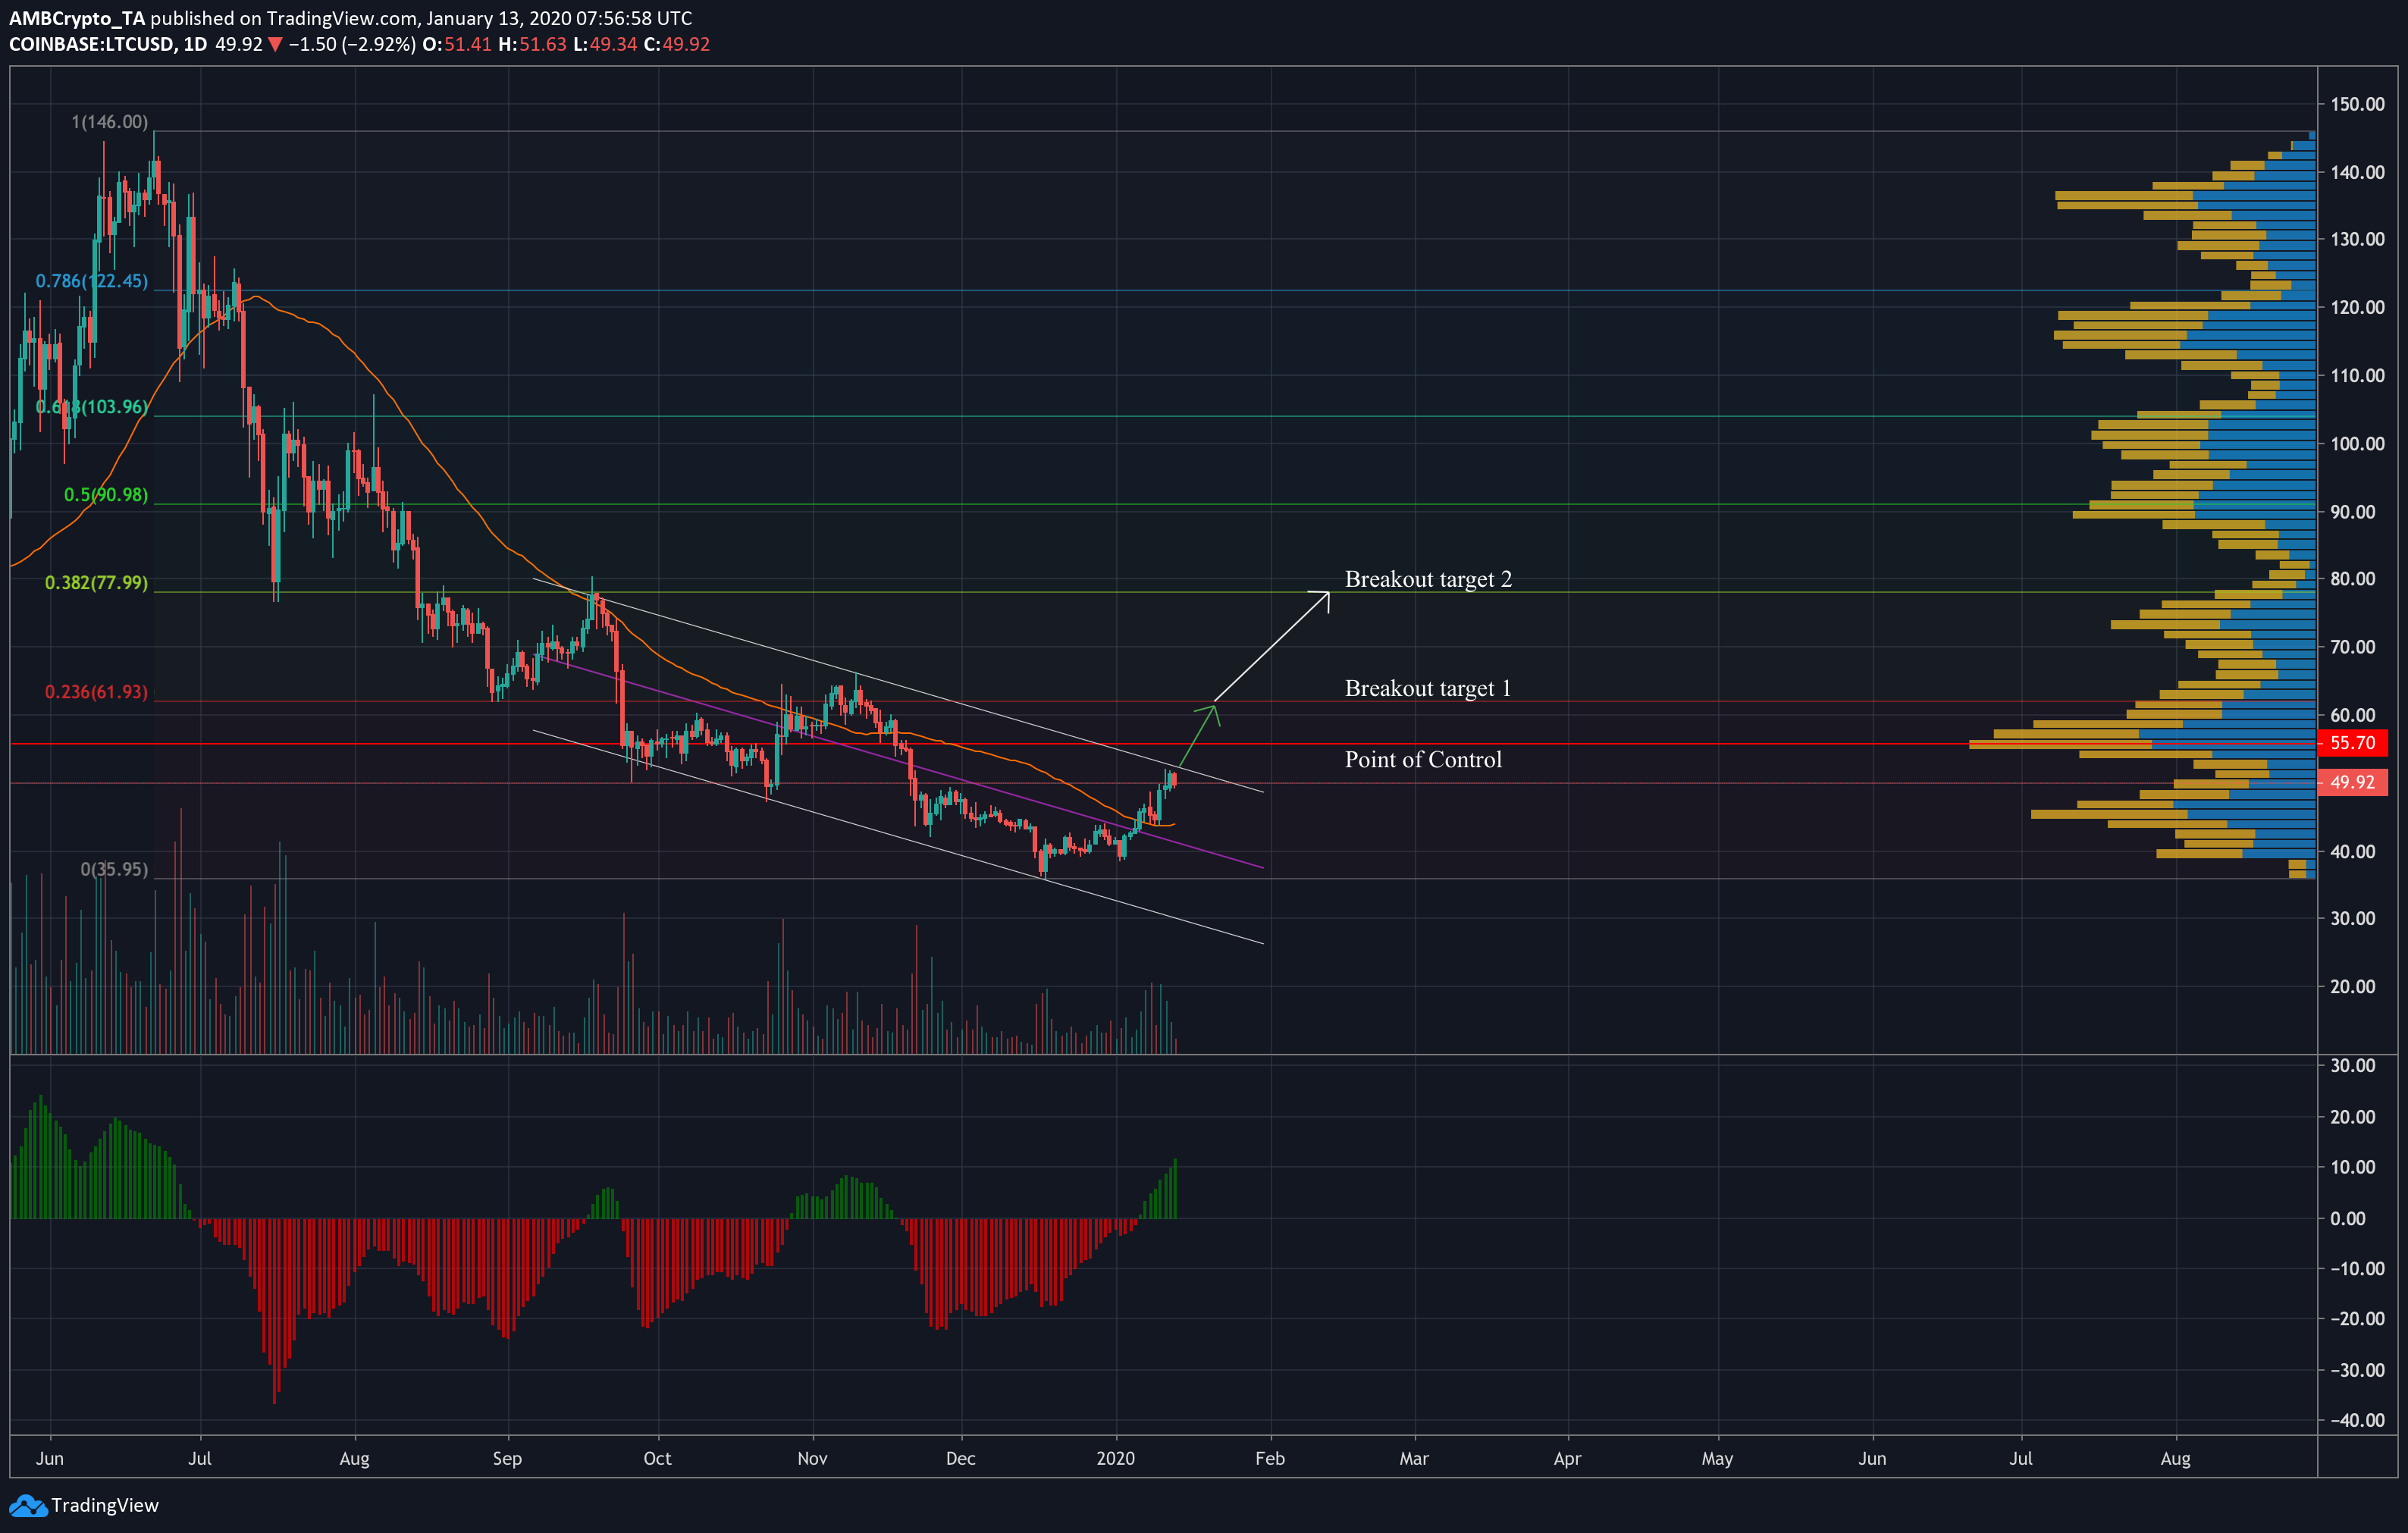
Source: LTC/USD on TradingView
Litecoin has been moving through a descending channel formation since mid-September, as can be seen in the above 1-day chart. These types of formations are usually continuation patterns, meaning a breakout upward seems more likely in this scenario. At the time of writing, LTC was testing the pattern’s upper boundary, and it looked like it might breach it.
50-day moving average was seen under the price candles, with Litecoin having crossed above it in the first week of January. The 50-DMA is generally a reliable indicator of performance, though not an iron-clad guarantee. However, the Elliot Wave Oscillator (EWO) indicator also showed bullish prospects for Litecoin in the near future.
The EWO indicator takes the difference between the 35 and 5-day simple moving averages and maps the value on a chart. At the time of writing, the oscillator was flashing green and looked to be increasing, which is usually a very bullish signal.
Market value vs realized value
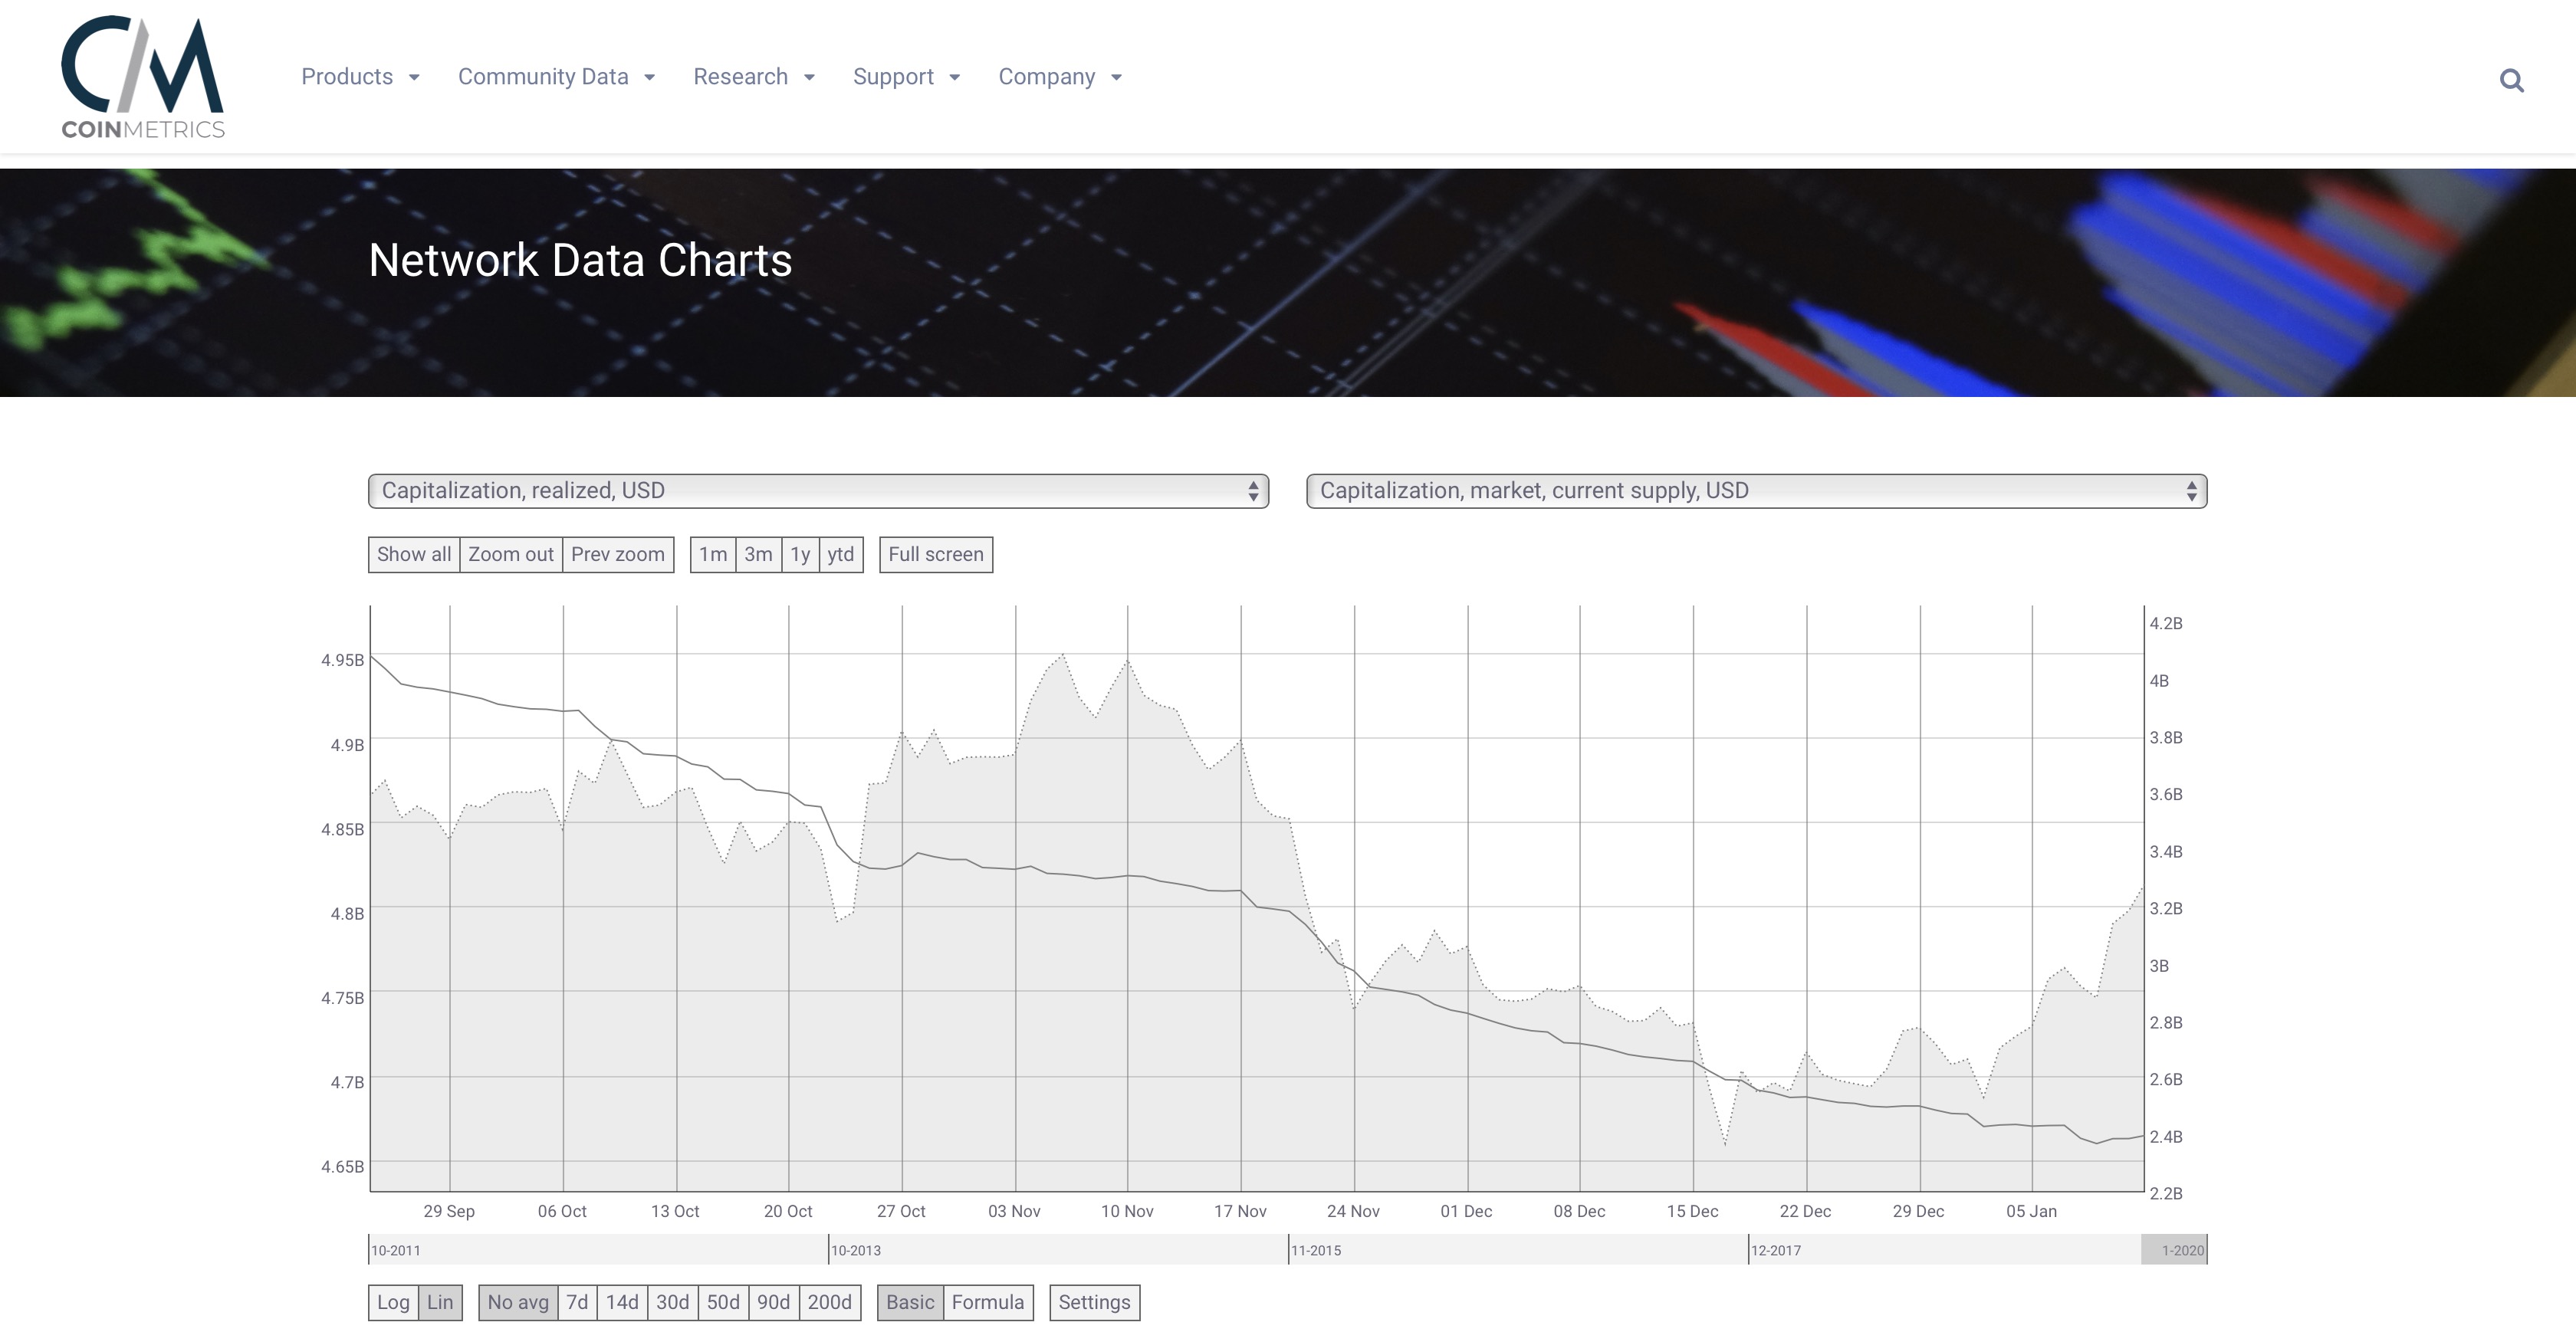
Source: CoinMetrics
CoinMetrics, a blockchain data analytics firm, has created a metric – ‘realized cap‘. It is similar to market cap, in that it is the sum of the value of all coins — only it calculates each coin’s value at the time of its last transfer. This creates a metric that shows whether the average investor would make a profit by selling right now. According to a senior research analyst at CoinMetrics, Nate Maddrey, a high market to realized value ratio can signify that a coin is bullish and slightly undervalued.
As the above chart shows, Litecoin’s realized cap has been declining since July last year, and crossed under the market cap value on October 24, after which Litecoin rose by around 40% in less than three weeks. With Litecoin’s realized cap well under its market capitalization, LTC could be in for a pump.
Conclusion
While there is the possibility that Litecoin could bounce back down into the pattern boundary, the almost overwhelming buy signals from indicators make this scenario less likely. With the 50-DMA signaling an upward price movement and the positive rising value of the EWO indicator, LTC will likely break above the pattern boundary to around $60, at the 23.6% Fibonacci retracement line, in the next couple of weeks. The high MVRV ratio could also signify a further pump to $80 by mid-February.
![Reasons why Litecoin [LTC] investors should be concerned](https://eng.ambcrypto.com/wp-content/uploads/2023/12/ambcrypto_A_Litecoin-themed_scen-400x240.png)