
Bitcoin’s price may be suffering from weekend slumps yet again and it has dropped over 11 percent from the $19,200 level. The market capitalization is down from $581 Billion to $512 Billion and on-chain analysts are comparing the price action in the past week to Gold’s fractal of the 70s. Mark Twain’s comment “history never repeats itself, but often rhymes,” seems to be rather appropriate here.
Other factors influencing the price drop are the supply on spot exchanges and the price volatility. However, if the sell-off that started yesterday continues, then contrary to popular opinion it may be bullish for Bitcoin’s price.
Source: Twitter
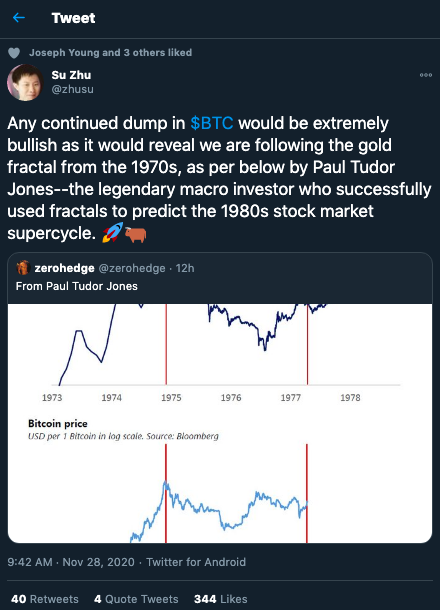
The CEO of Deribit Exchange, @zhusu commented on the price drop and how it has echoes of the gold fractal from the 70s
“Any continued dump in $BTC would be extremely bullish as it would reveal we are following the gold fractal from the 1970s, as per below by Paul Tudor Jones–the legendary macro investor who successfully used fractals to predict the 1980s stock market supercycle.”
With Bitcoin’s dropping correlation with gold, the narrative of “store of value” and Bitcoin as digital gold is now replaced by the supply shortage narrative. This is not only because of the fundamental analysis but based on Bitcoin’s correlation with Gold and its price chart, from CoinMetrics it is noted that Bitcoin technically tends to follow Gold’s long-term cycles on a logarithmic scale. And if it follows as closely as it did in the past 3 months, since September 2020, this signals that after breaking the ATH traders could expect a medium-term pull-back over the weekend.
In addition to the correlation with Gold and the dropping price, the active supply is dropping as well.
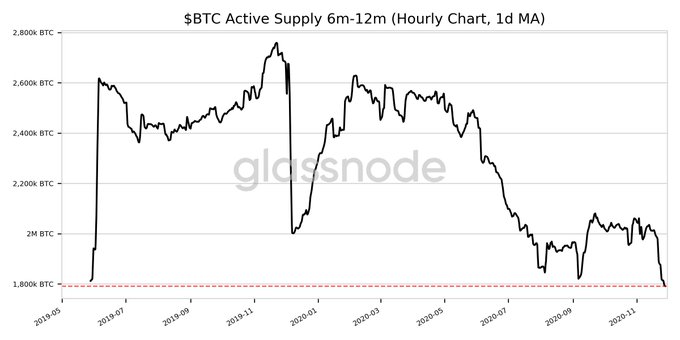
BTC Active Supply Chart || Source: Glassnode
The supply has dropped to its lowest level since 2019. If it continues to drop further, the shortage narrative may come into play again, as the price rallies when institutions start buying again. This may be a signal that the cycle from the past week may repeat itself. It’s interesting that this development is accompanied by Citigroup’s announcement of a $2500 price target for Gold in 2021. Citigroup compared Gold to its 1970-80 bull market. Back in 1970 and 80 gold had dramatically outpaced the money supply per capita. That makes it similar to Bitcoin’s price rally of 2020. 1970s or not, Bitcoin is likely to shake off the slow weekend on Monday with more demand and a dropping correlation with Gold.