- The surge in leverage-backed ETH trades on Deribit hints at looming price swings.
- Also, key volatility markers confirmed the presence of volatility in the coin’s spot market.
The steady uptick in Ethereum’s [ETH] Leverage Estimated Ratio on derivatives exchange Deribit hints at upcoming price swings, CryptoQuant analyst Joao Wedson has noted in a new report.
The Leverage Estimated Ratio indicator (ELR) measures the average amount of leverage traders employ to execute trades on a cryptocurrency exchange. It is calculated by dividing the open interest of an asset by the exchange’s reserve for that currency.
When an asset’s ELR on an exchange increases, it means the traders are using a significant amount of leverage. This can amplify both profits and losses and occasion price swings.
Conversely, a low ELR suggests that traders are using relatively little leverage, which may result in less volatile price movements.
According to Wedson, Deribit is the “epicenter of highly leveraged Ethereum.”
Therefore, a growing ELR on the exchange might impact the general market.
He added further:
“Prices on Deribit may exhibit a more negative or positive premium compared to other exchanges, indicating a higher risk when engaging in trades on this platform. Open Interest continues to grow daily, signaling a steady increase in demand for leveraged positions.”

Source: CryptoQuant
Growing volatility in the spot market
Assessing a few volatility markers on ETH’s spot market confirmed Wedson’s position.
Firstly, the past three weeks have been marked by a widening gap between the upper and lower bands of ETH’s Bollinger Bands (BB) indicator. When the gap between the bands widens in this manner, it signals increased volatility in the market.
Moreover, the coin’s Bollinger Bandwidth (BBW), which has trended upward by 76% since 22nd October, confirmed the volatile nature of the current ETH market.
Further, ETH’s Average True Range (ATR) – which measures market volatility by calculating the average range between high and low prices over a specified number of periods – was 75.54 at press time. Also maintaining an uptrend, it has risen steadily in the past few weeks.
A rising ATR suggests that an asset’s price is moving more widely from period to period, hinting at the presence of volatility in the market.
Is your portfolio green? Check out the ETH Profit Calculator
Lastly, ETH’s Chaikin Volatility was spotted at 44.42 at press time, having risen by 51% since the month began. This indicator measures the difference between an asset’s high and low prices over a specified period.
When the Chaikin Volatility indicator rallies to return higher values, it signals great price movements and potential volatility.
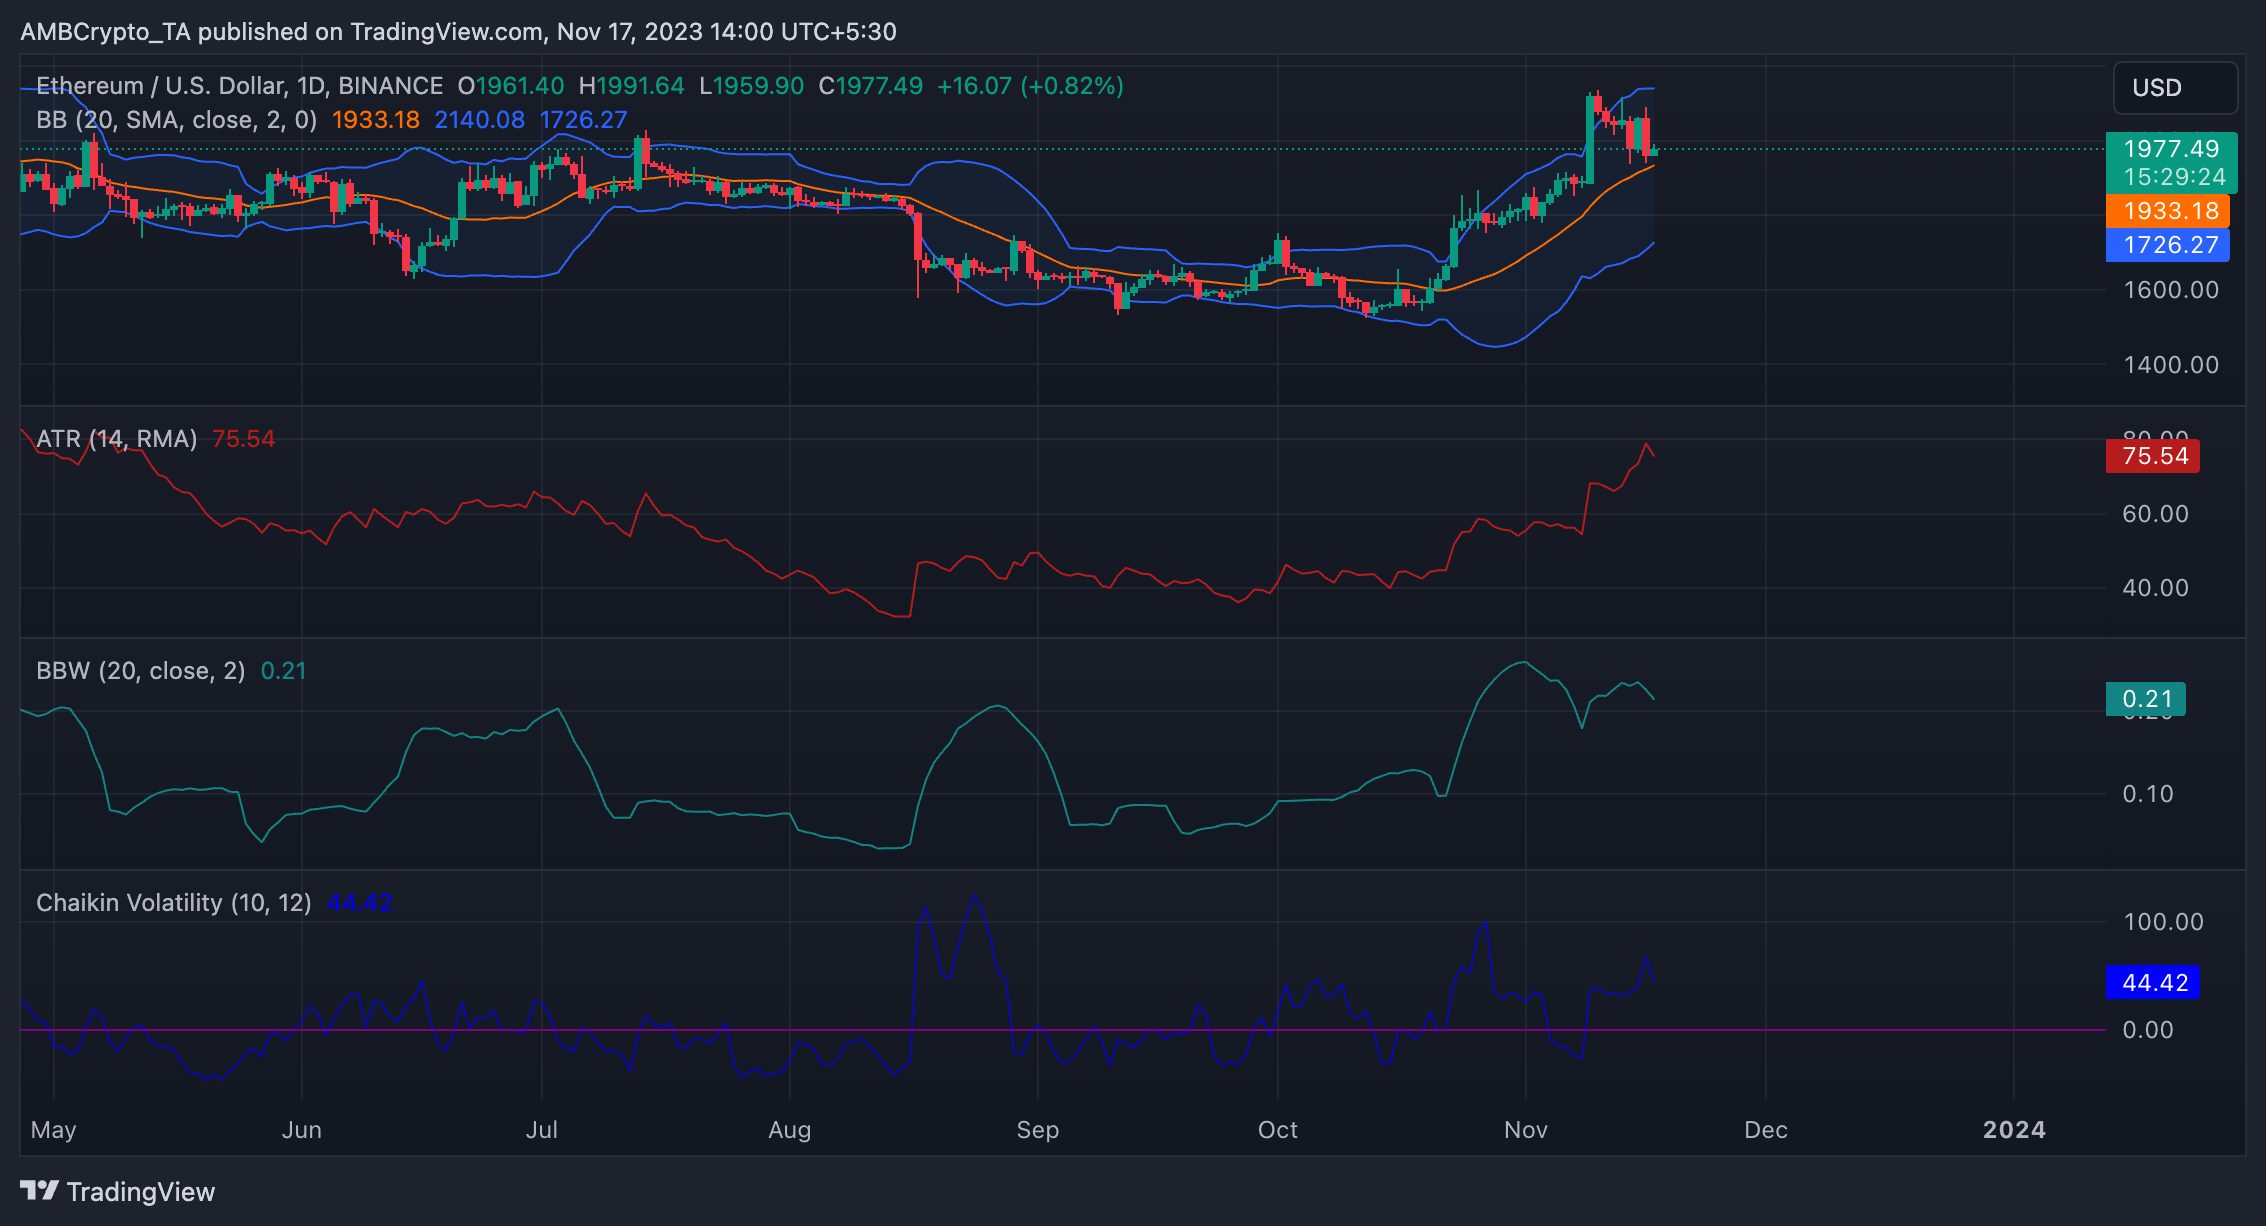
Source: ETH/USDT on TradingView