Ethereum’s healthy on-chain activity undercuts price downtrend

Ethereum and the ecosystem it hosts have been on a ride this last week, particularly the DeFi ecosystem. This was mainly due to the recent hype around yield/liquidity farming. Interestingly, all of this is happening at a time when ETH is transitioning into PoS.
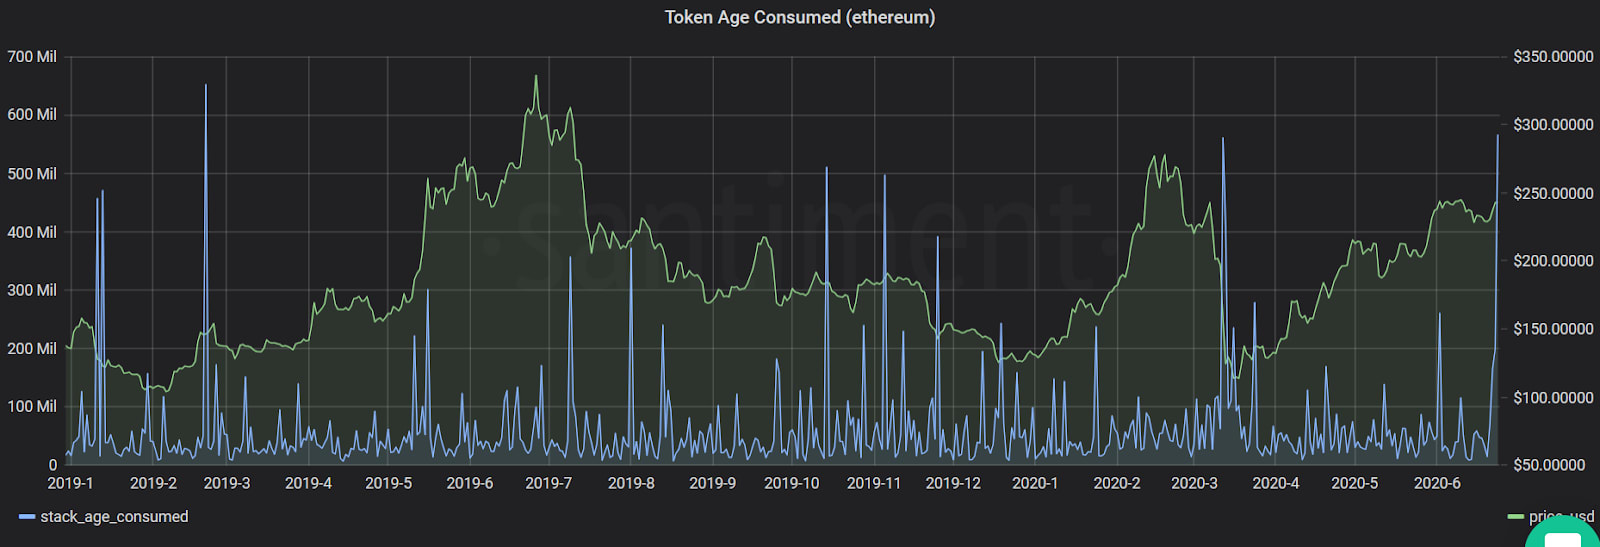
Regardless, ETH is still the second-largest cryptocurrency in the market, one boasting an excess of $25 billion in market cap and priced at $230 per token. With its miner revenue picking up, Ethereum’s on-chain metrics like token age and velocity are also touching new highs, levels unseen since February 2019.
Ethereum Token Age

Source: Santiment
This metric tracks the dormant coins and their activity and is quite similar to Bitcoin’s hodl waves. It is essentially a representation of dormant coins in motion and upon observation, it can be noted that the addresses related to the moved ETH belonged to the infamous PlusToken scam.
However, other reasons for the move could be connected to Ethereum’s transition to Proof-of-Stake or the new-found hype around DeFi and yield farming. In fact, the PlusToken scam was alleged to be the reason for the latest Bitcoin drop. Since more of these stolen ETH and BTC are yet to be moved, only time will tell what effect those movements will have.
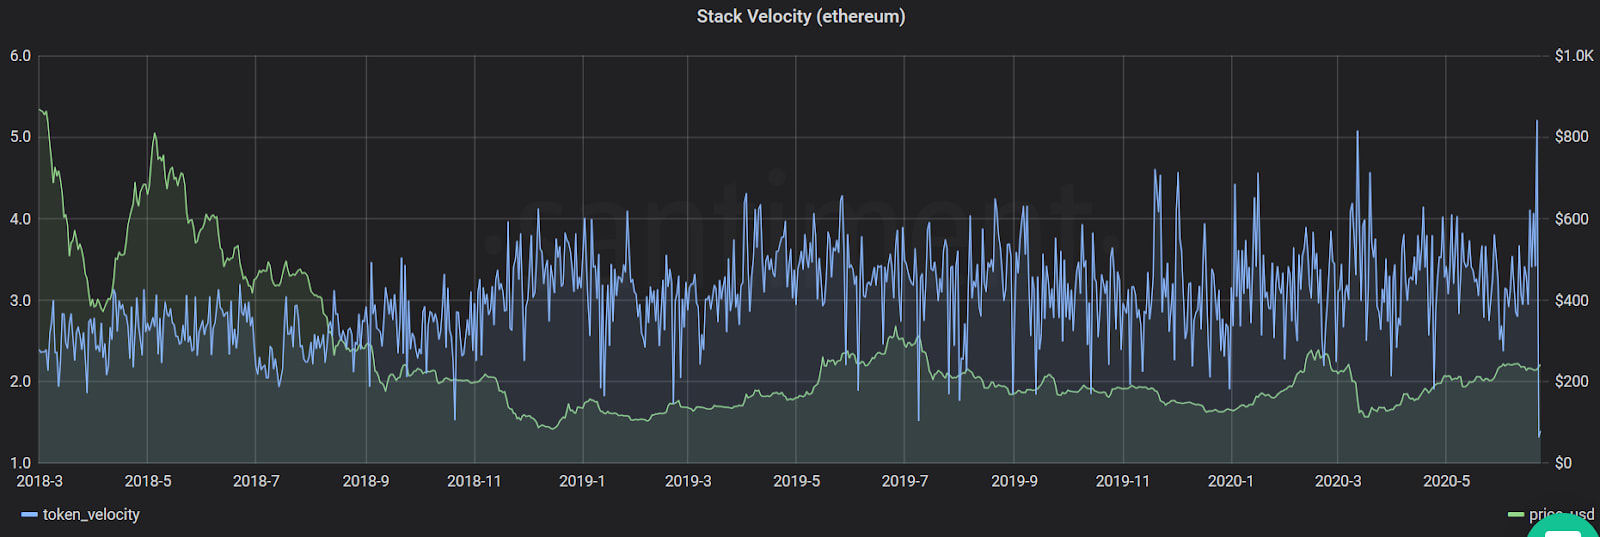
Ethereum Token Velocity

Source: Santimanet
Ethereum Token Velocity is a metric that tracks the average number of times active Ethereum tokens change addresses. The token velocity metric can be used to determine the health of a network and is typically calculated by dividing the 90-day estimated USD transaction volume by the 90-day average USD market cap.
This metric, as seen above, spiked up to 5.2/day, the highest level it has reached since the shutdown of a notorious ETH mixer that operated until early-2018.
It should be noted, however, that while both these indicators have surged higher, they do not necessarily underline a bullish/bearish effect on the token’s price.
ETH price
Source: ETH/USD on TradingView
From the above, it is clear that ETH is on a downtrend. However, it seems that the 50 DMA [yellow] will prevent the price from dipping even lower. In light of its correlation with BTC, ETH might just breach the 50 DMA, if Bitcoin crashes.


