Ethereum decoupling from Bitcoin as halving pressure sets in

Ethereum may present itself as the decentralized version of the Internet in the face of Bitcoin, the decentralized currency, with it creating a more principled image. But on the price front, it still trails the largest cryptocurrency on the market.
The Robin to Bitcoin’s Batman, Ether, the currency connotation of Ethereum, has since the beginning of the year been separating from Bitcoin. At the beginning of the year, as the price of Ether began to skyrocket, the separation seemed to be initiated by the altcoin. Now, as Bitcoin’s halving is done and dusted, it is looking to pull away from the altcoin for the foreseeable future.

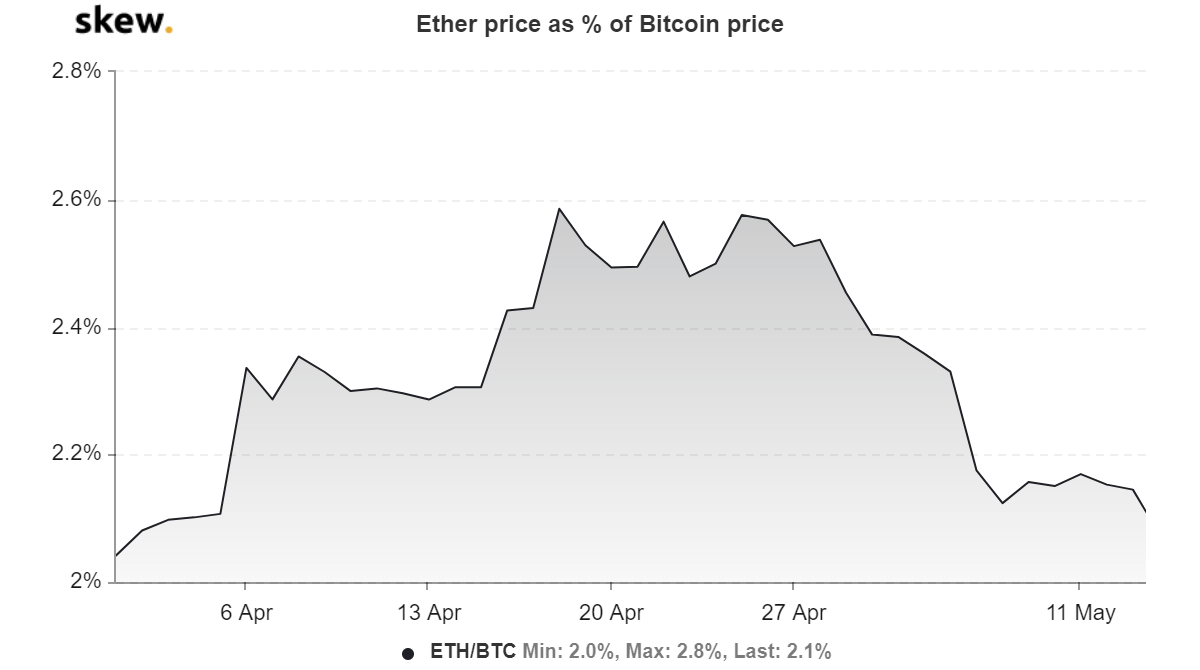
ETH as a % of Bitcoin | Source: skew
As the price of the respective cryptocurrencies began to go through the immediate after-effect of the ‘halving,’ ETH compared to BTC is shrinking. Data from Skew markets suggests that the price of Ether as a percentage of Bitcoin has shrunk to 2.1 percent, its lowest in over a month. In fact, the only time ETH’s price as a percentage of Bitcoin slipped below 2 percent was way back in March 2017, during the ‘crypto-winter.’
This disproportional movement between the cryptocurrency market’s two biggest coins began two weeks prior to Bitcoin’s halving when the proportional price was 2.6 percent. As Bitcoin’s price rose from below $8,300 then to within touching distance of $10,000, and Ether relatively stagnated, the difference grew.

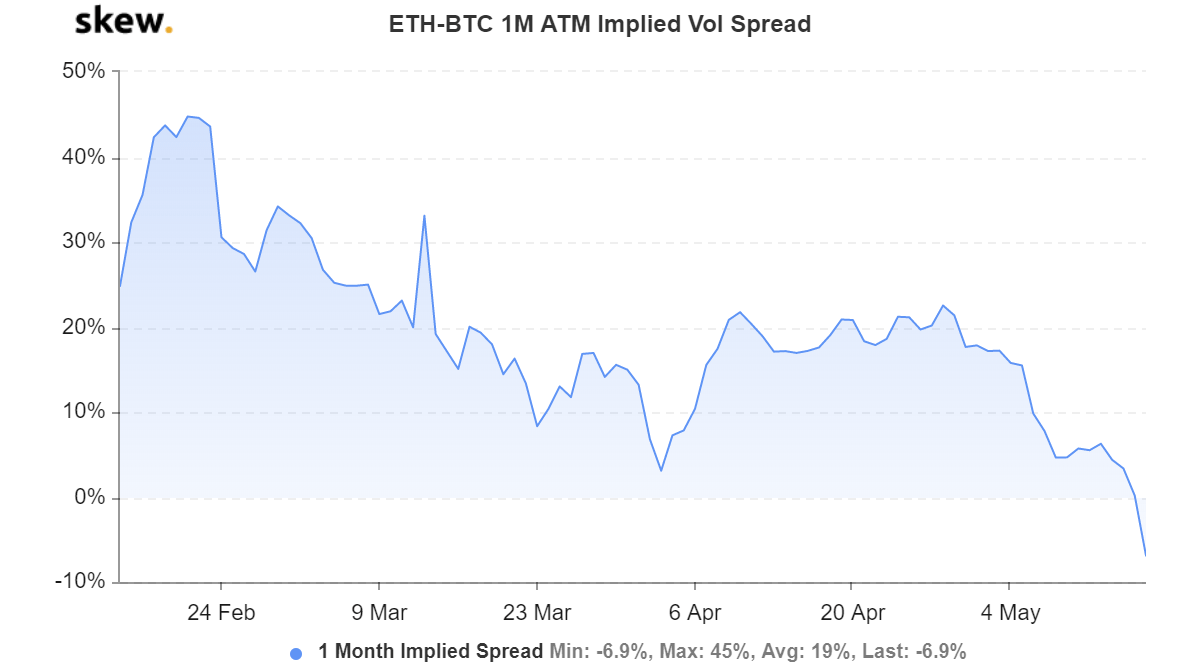
ETH-BTC Implied volatility | Source: skew
During the above phase, it was noted that the price of Ethereum relative to Bitcoin was falling. However, now that the periodic event is done and dusted, the price divergence between the two assets is less straightforward.
For the first 1 to 3 months, the two assets will trade with less volatility, relative to their own prices i.e. the implied price volatility of Bitcoin to Ethereum is looking to drop as attested by both the 1-month and 3-month implied volatility charts. Both the metrics [IV 1-month and 3-months] dropped to their lowest points in over 6 months at -6.9 percent and 3.1 percent, respectively.

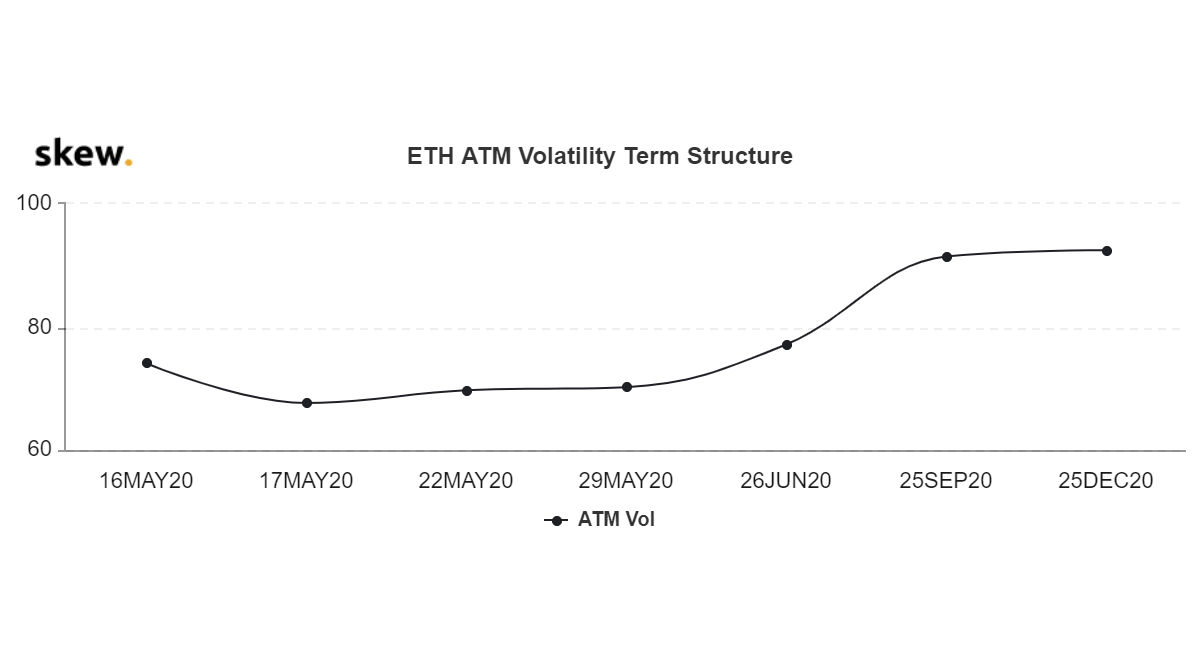
ETH volatility term structure | Source: skew
However, after this period, a change is likely, but not consistent. The volatility term structure of the two cryptocurrencies, based on the pricing of their Options contracts, show volatility peaking for Bitcoin at the end of June 2020 and for Ethereum in September 2020.
As things stand, in terms of expected price movement, Ethereum is moving away from Bitcoin, but will rejoin the king coin in the next few months when Bitcoin will peak in volatility followed by Ethereum. Rest assured, if you’re either a Bitcoin or an Ethereum maximalist, you’re in for a roller-coaster ride.


