
At the time of writing while bearishness on the charts from the morning lows was visible, price recovery attempts towards the second half had also started.
The bearish sentiment in EOS quickly turned into a strong price recovery move, with EOS bulls regaining control of the short-term market. Algorand’s recovery still not as strong, but was also seen taking a similar path.
Ontology, however, struggled to make any gains, as it continued to be highly bearish.
EOS
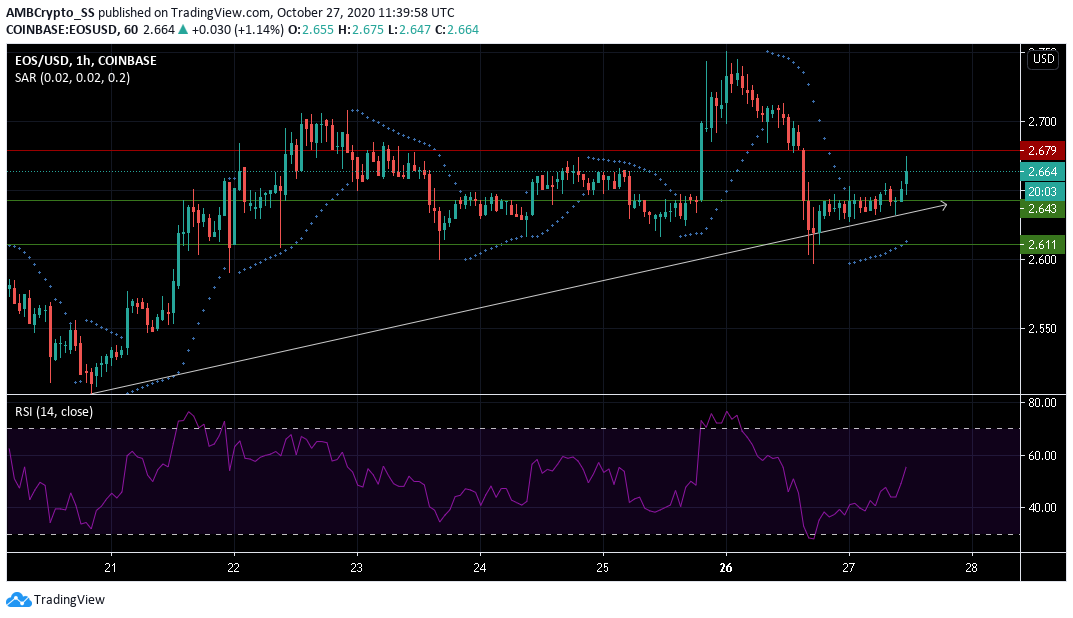
Source: EOS/USD on TradingView
The digital asset after falling from $2.750 yesterday, was seen making a recovery as it pushed above the $2.61 level of support. At the time of writing, EOS was trading at $2.664 still a percent below yesterday’s levels, despite price recovery attempts.
Parabolic SAR’s dotted lines below the price candles suggested an uptrend. Relative Strength Index too favored the bulls and was seen rising towards the 60 level.
Any further rise in buying pressure could push prices further up, as EOS bulls attempt to retake control at the $2.679 level of resistance.
Ontology [ONT]
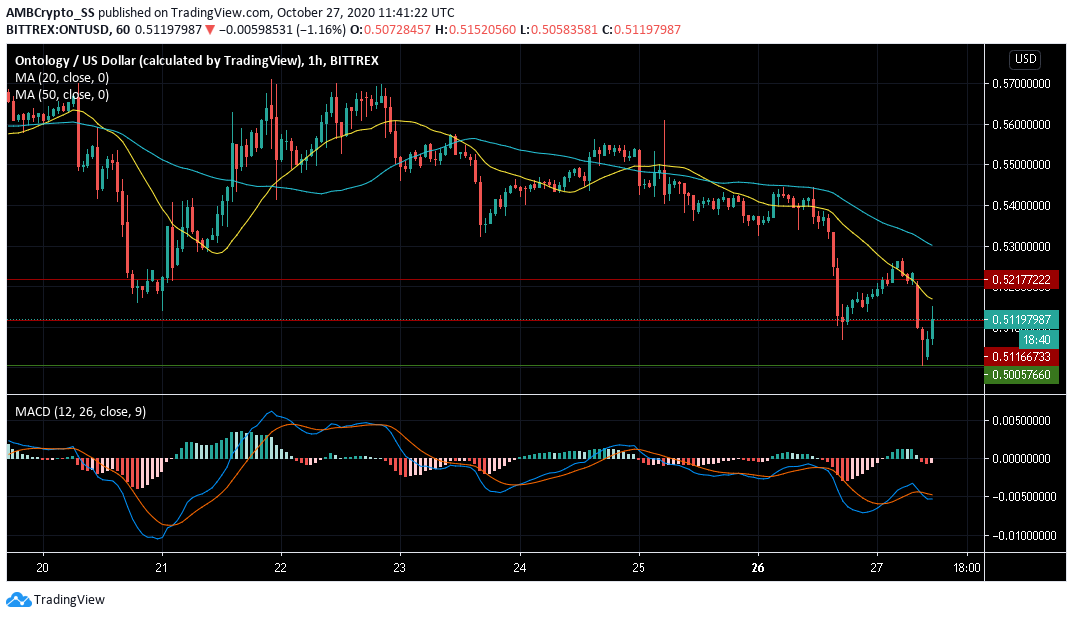
Source: ONT/USD on TradingView
For Ontology, the 20-period simple moving average (yellow) was seen ticking to the downside, way below the 50 SMA (cyan). This indicated that momentum in the short term was driving price towards the $0.50005 level of support.
The MACD also gave a sell signal as it was seen making a bearish crossover. However, during press time, ONT bulls were seen attempting to push prices towards the $0.511 level of resistance.
A further descent under the 20 SMA trendline(yellow) could delay a price recovery, as this would add to the bearishness in the ONT market.
Algorand [ALGO]
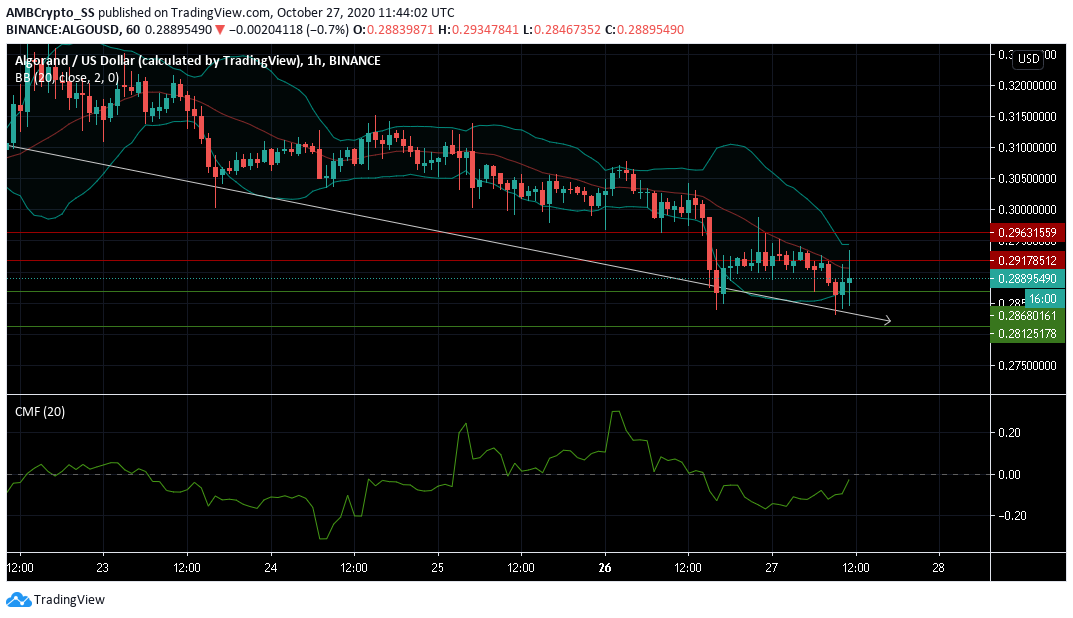
Source: ALGO/USD on TradingView
Algorand after reeling under sufficient selling pressure finally managed to breach the $0.291 level of resistance. This could be a reversal after the digital asset displayed a descending channel pattern.
The Chaikin Money Flow Indicator was attempting to make cross above the zero line, a signal of future capital inflows being higher than outflows, however, the bearish scenario was far from over.
At the time of writing volatility also seemed to be on the decline, with a hint of convergence visible from the Bollinger bands.