A pullback from the red zone for Crytpto.com Coin (CRO) and Tezos suggested that a strong reversal cannot be ruled out for the two alts, as they attempted to retrace gains from the previous week.
While technical indicators for the Tezos and CRO market underlined bullish sentiments, a strong descent to the downside was visible on BitTorrent’s bearish trading charts.
Crypto.com Coin [CRO]
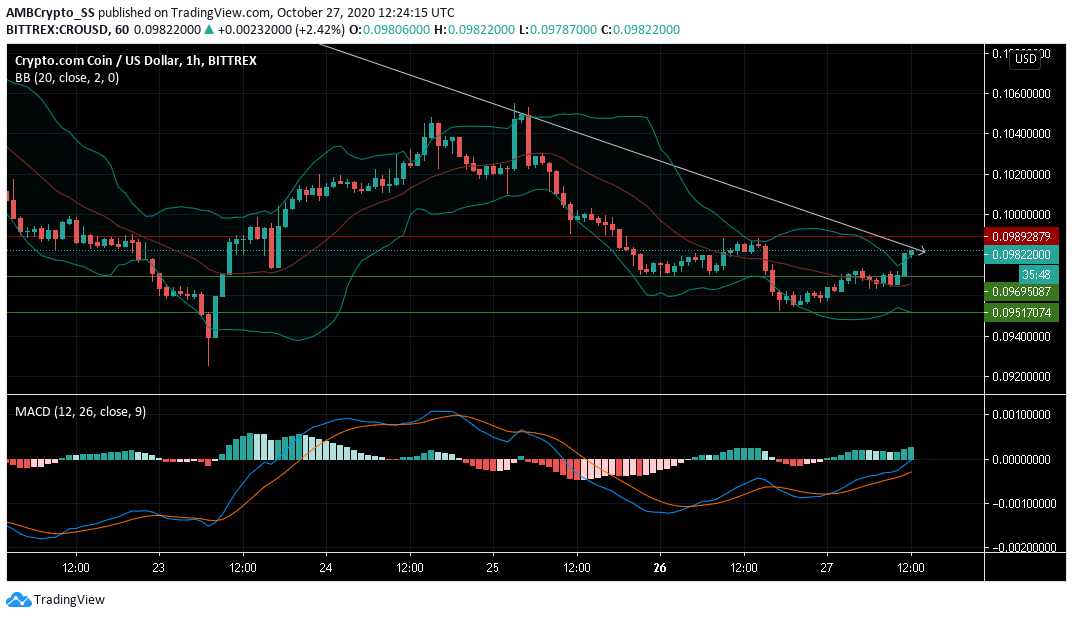
Source: CRO/USD on TradingView
Crypto.com Coin at the time of writing recorded a price correction in the last 48 hours, as it fell from the $0.105 level, and witnessed a price slump towards its immediate support level.
However, at press time, in a bullish crossover, the MACD line rose above the signal line, coinciding with the pull pack of prices above the $0.096 support level.
The high volatility levels witnessed from the widening of the Bollinger bands, gave scope for further price action which could be favoring the bulls. Given the buying momentum, a price rise above the trendline and towards the $0.098 resistance level remains a likely scenario.
Tezos [XTZ]

Source: XTZ/USD on TradingView
At the time of writing, Tezos was trading at the $2.11 level, almost 7.5% lower than the crucial level of support turned resistance at $2.134.
The dotted lines of the Parabolic SAR below the candles hinted towards an uptrend, which was further supported by the rising buying pressure picked up from the Relative Strength Index.
At press time, RSI witnessed a strong pullback from the oversold region as it continued to make higher highs. This also hinted towards the formation of a rising valley formation, a bullish pattern, that could potentially result in the breach of the $2.134 resistance level in the next few days.
BitTorrent [BTT]

Source: BTT/USD on TradingView
BitTorrent at press time was seen trading within a range, between the 78.6% and 100% retracement levels, marked by the Fibonacci retracement tool.
The digital asset lost more than 5% in value over the last 48 hours and was succumbing to a bearish scenario, as could be seen from the Aroon Indicator.
The early signs of a bearish crossover were visible, with the Aroon Down (Blue) starting to rise above Aroon Up (orange).
A strengthening of this trend could help BTT bears maintain prices below the 78.6% retracement region, over the next few trading sessions.