
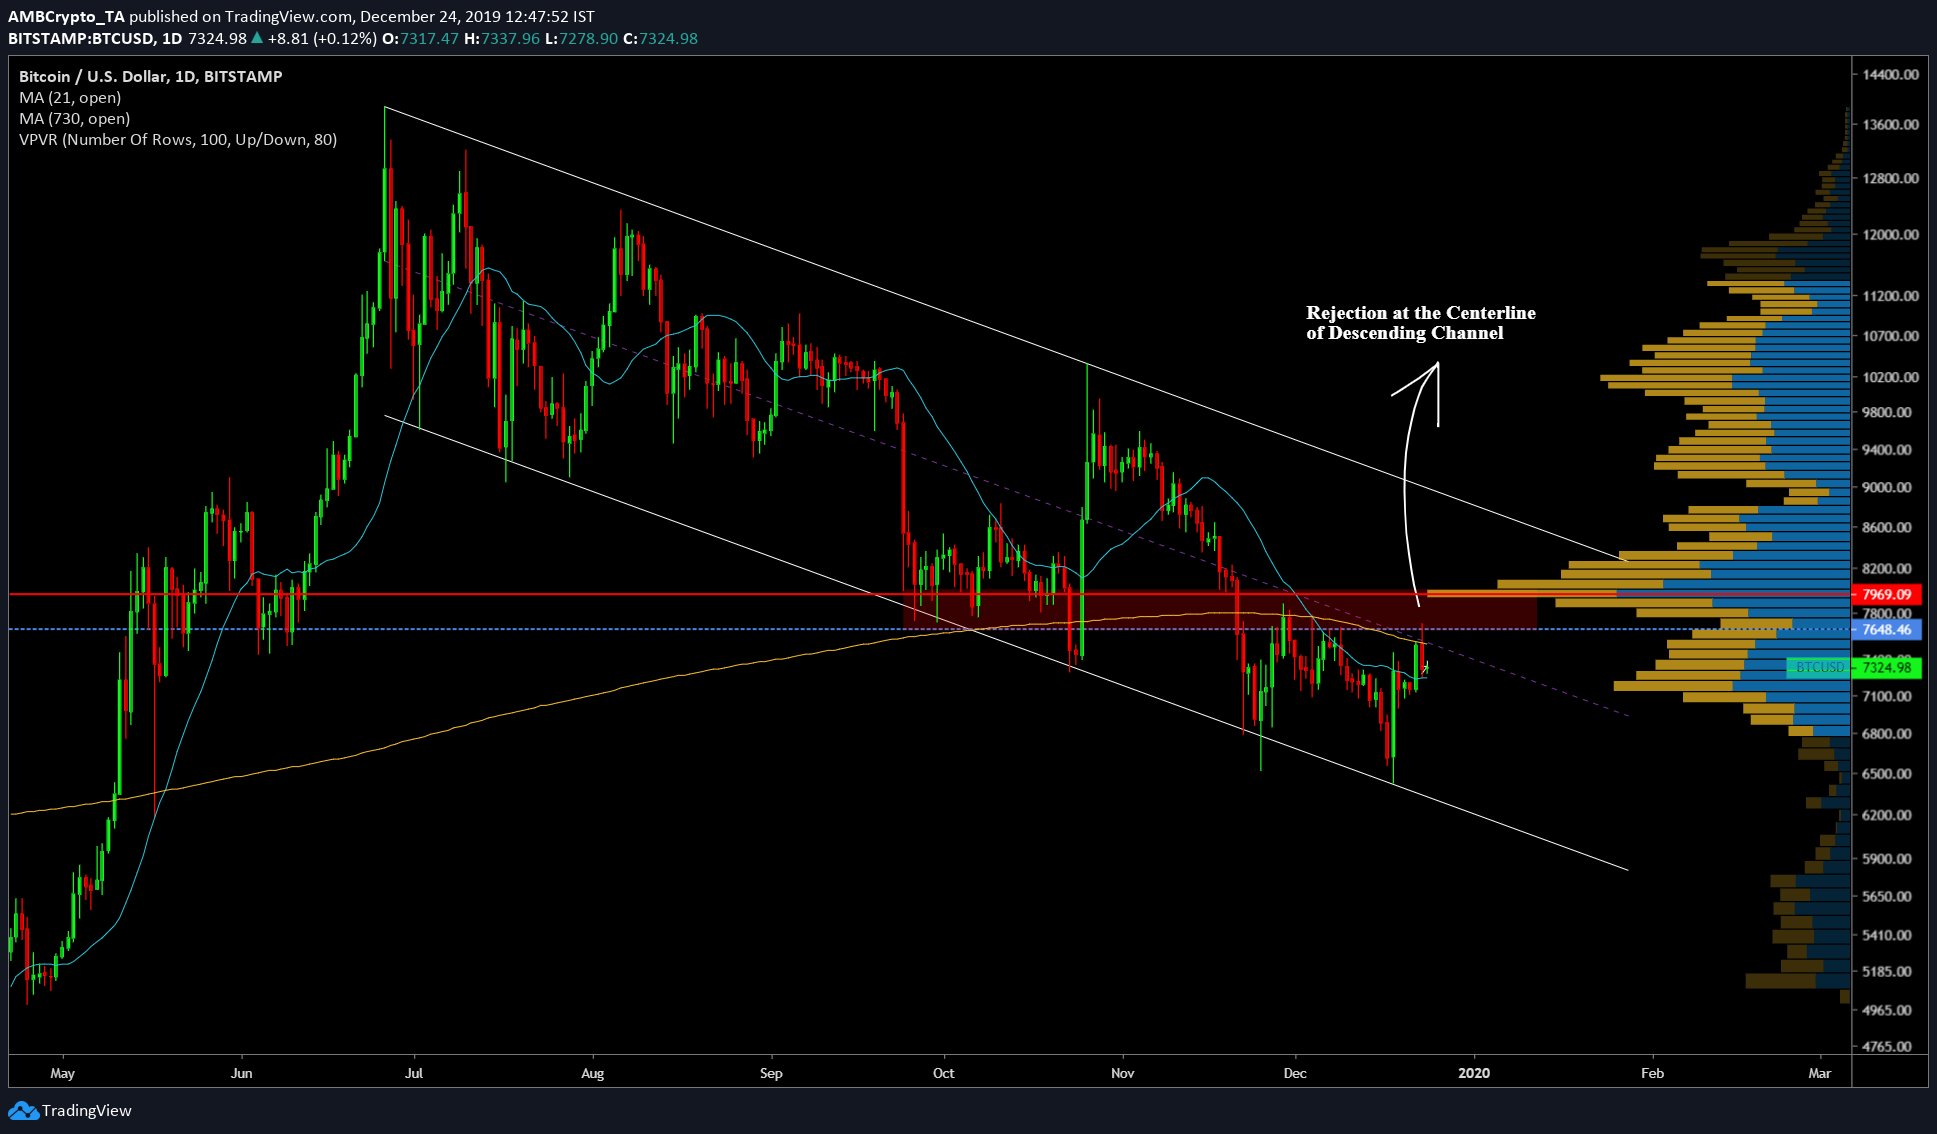
Bitcoin’s daily close yesterday confirmed that there will not be any more upside, at least, nothing above $7,600. Moreover, the indicators that exhibited bullish trends have slowed down; they are on the verge of a reversal. Moreover, the price also got rejected by the centerline of a major descending channel seen on the daily time frame.
Weekly Chart

Source: BTC/USD TradingView
Excluding the current candle, the weekly chart showed 4 candles at more or less the same range indicating sideways movement occurring on a larger time frame.
MACD indicator on the weekly timeframe is extremely bearish and is continuing to head below the zero-line further confirming looming bearish bias. Adding to the already bearish scenario is an increasing gap between the price and the 21 weekly moving average. As price gets rejected here, the gap will increase furthering the bearish bias.
Daily Chart
Source: BTC/USD TradingView
After a bearish close yesterday on the daily time frame, the current candle has started turning red. There is, however, a chance for 4% upside. At the same time, MACD will readjust and form a bearish crossover, confirming the bearish case for Bitcoin.
The On-Balance-Volume indicator is also decreasing and has come close to $1.46 million, a level seen quite a few times and spaced out with a month’s gap; September 25, October 25, and November 25. This could act as a support and push the price higher, further adding credibility to the 4% upside movement pointed out in the weekly chart. The RSI has turned neutral indicating sideways movement.
Another interesting indicator on the daily time frame is the 2-year moving average, which was rejected after yesterday’s close. This level was just below the point of contact seen on the VPVR indicator which also showed heavy resistance upwards of $7,600.
4 Hour
It is a known fact in the trading that trends breakout from the inside or shorter time frames; on the 4-hour time frame, the MACD has turned bearish. However, RSI remains at the 50-level even on the 4-hour chart.
Other variables that can be factored are the 30-day volatility and the 1st spend, both of which indicate a bearish or a sideways movement.
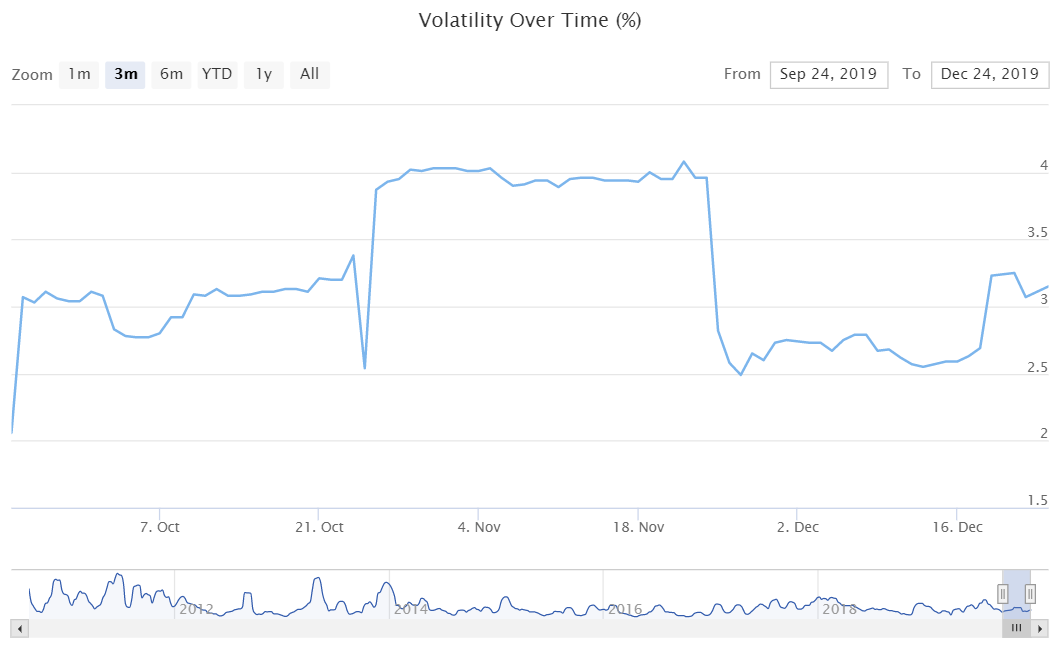
Source: BitVol.info
The volatility of Bitcoin has hit 3% and will now move sideways for a while until the whales sway BTC to either side and increase the volatility. At this point, there is a chance that the volatility will rise up to 4%.
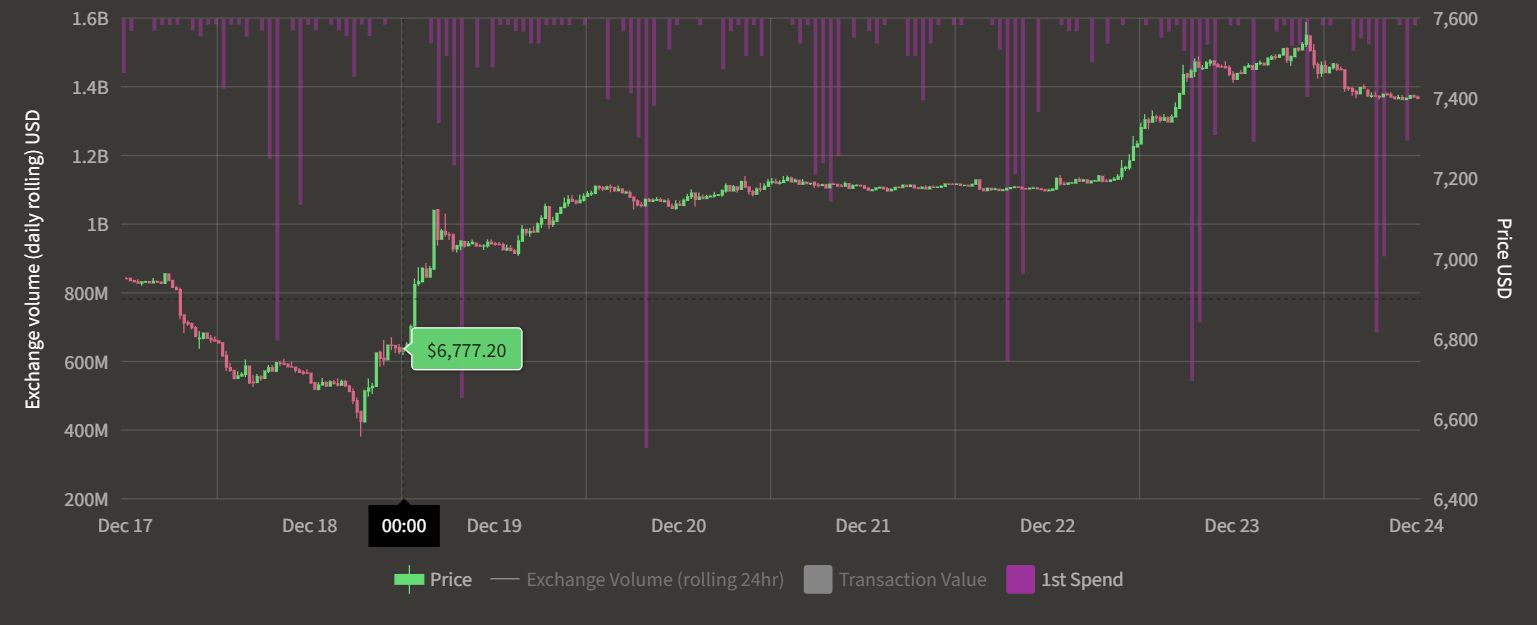
Source: ByteTree
Since the last week, miners’ 1st spend has been consistent at BTC worth $4+ million. This indicates that the price of BTC at this level is not profitable to a lot of miners in the west leading to a sell-off.
Conclusion
The next 24 hours for Bitcoin will be bearish without a doubt. The price will test the $7,200 to $7,000 level, further bearish momentum would push the price lower to $6,900 to $6,800.