Bitcoin’s descending channel highlights possible return of the bulls

The volatility and unpredictable nature of cryptocurrencies is one of the most sought after, but equally frowned upon characteristics of the crypto-market. On a good day, investors can yield up to 50 percent in profits on their crypto-investments, whereas on a bad evening, there is a chance their positions could lose all their value.
Bitcoin faced a similar situation lately.
After holding its ground comfortably above the $10,000 range for a long time, the price came crashing down on 24 September, suffering a fall of around 18 percent and breaching a major support line at $9,720. Afterwards, the coin failed to exhibit a major pullback and at press time, Bitcoin was valued at $8,150.83. When compared to the world’s largest cryptocurrency however, Ethereum and XRP avoided a major crash.
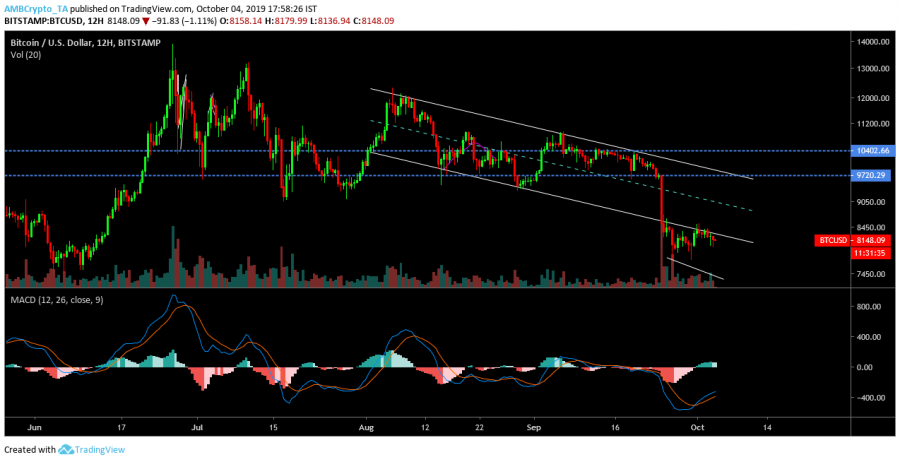
12-hour chart

Source: BTC/USD on TradingView
Bitcoin’s steep decline would have come across as a major blow to a majority of users, but there were positive signs on the long-term chart. Analyzing the 12-hour window, the price movement of BTC projected the formation of a descending channel that dated back to the beginning of August. The price treaded between the trend lines without any breach. The pattern suggested that a bullish breakout was in the cards for Bitcoin, but a fakeout was also suggested. The price was recovering at press time, and a positive breakout should see BTC retest its major resistance at $9,720.29.
The MACD indicator appeared bullish, validating the impending bullish break. The volume also appeared to fall in the charts. Significant momentum may see a retest of the resistance at $10,432. However, that remained highly unlikely at press time.
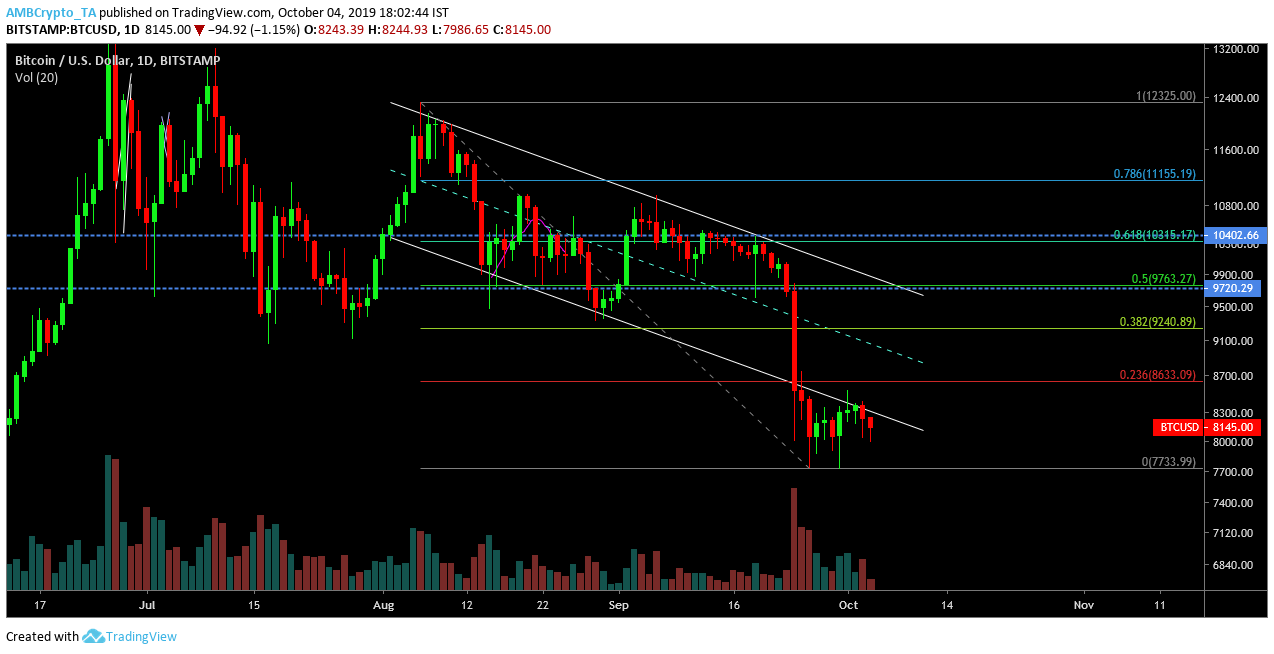
1-day chart

Source: BTC/USD on TradingView
The 1-day chart recorded some similarity to the 12-hour model, and gave a better idea of the potential resistance for a bullish break. According to the Fibonacci retracement lines, the immediate resistance was placed at $8,633.09, followed by a resistance point at $9,240.89. Previously, it was predicted that Bitcoin would face a major fall in the short-term, where the prices can re-visit the range of $7,000. The next few weeks are critical for Bitcoin’s long-term valuation as the coin enters Q4 of 2019.


