Bitcoin’s ATH of $19k is still 33% away. Bitcoin’s price is up 14.85% in the past 7 days and market conditions are conducive for further growth. From smart money inflow of over $550 Million within 2 weeks to drop in inflow on exchanges, nearly all charts signal the bullish sentiment.
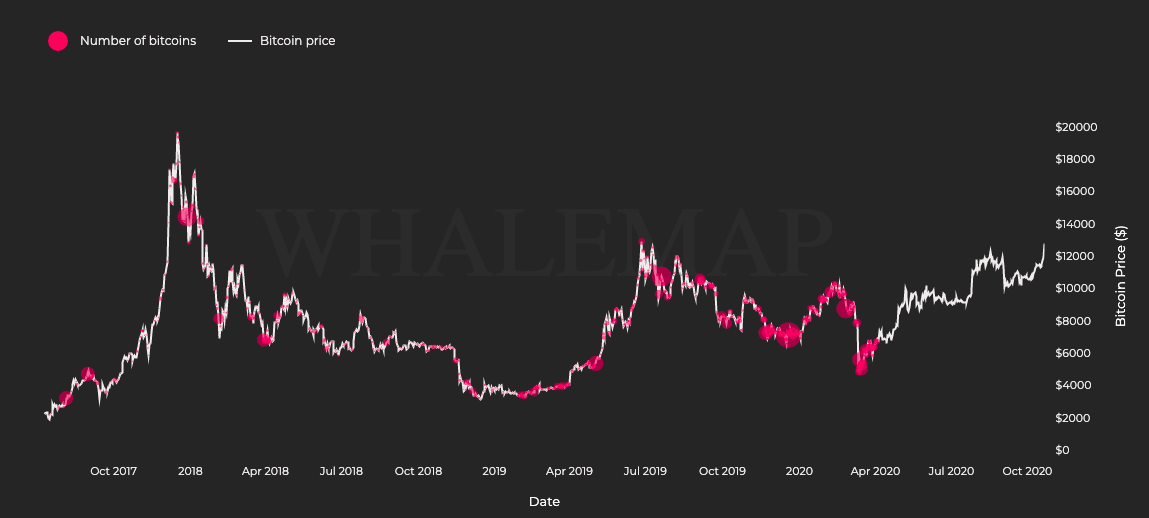
Map of spent Bitcoins || Source: Whalemap
Based on the map of spent HODLer Bitcoins, Bitcoins accumulated at different price levels since 2017 are being sold, at the current price range. 95% HODLers are sitting on unrealized profits and this is up from 86% two weeks ago. Besides price and transaction charts, trends in MPI are similar to 2017.
The 2017 bull-run was driven by miners, and though the current bull-run is not entirely driven by miners, the MPI is repeating the 2017 trend.
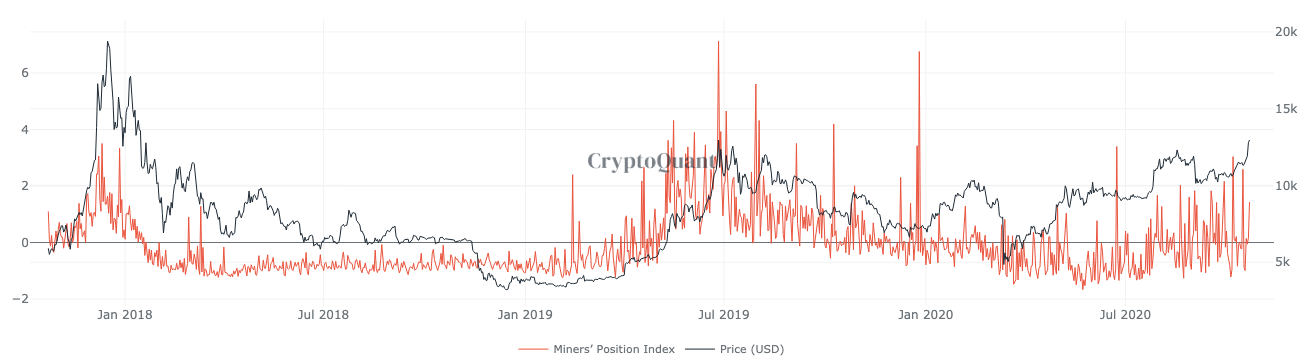
MPI || Source: CryptoQuant
However, will the price sustain at the current level? The current price rally is driven by scarcity. Since early September miners have been HODLing and inflow to cryptocurrency exchanges has dropped dramatically. It dropped below the 180-day average. Basic economics dictates that scarcity drives the price upwards, however, at the current price level over 75% of sellers are selling at a profit. The price rise is emulating the previous bull-run and this is driving the narrative of price recovery.
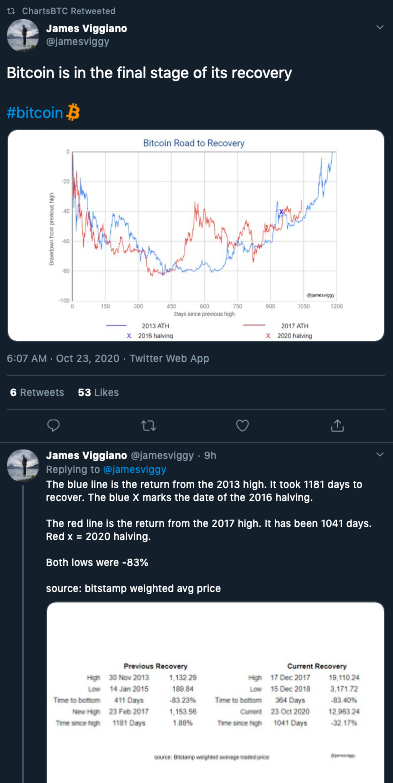
Source: Twitter
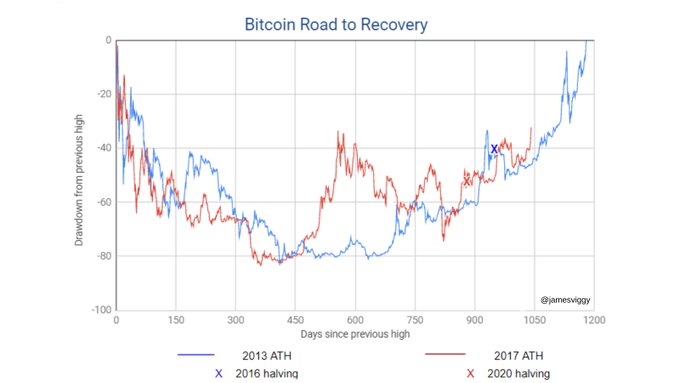
Crypto Twitter is flooded with tweets driving the narrative of previous and current recovery of Bitcoin’s price. The previous recovery before hitting ATH took 13 months or approximately 1181 days and we are in the twelfth month of the current recovery. The reason for drawing this parallel is that the price dropped 83% both times.
Source: Twitter
The chart represents both prices, 2016 Halving and the 2020 halving, the performance from 450 to 750 days is opposite, however, the initial drop and the eventual recovery are nearly identical. With smart money inflow and increasing demand, the price may be ready to pull all stops and race to the top. How long this will sustain remains unknown at the moment, however, buying pressure may increase. The price may encounter correction before hitting the previous ATH, but continues on its mission of closing the gap to $19000.