Disclaimer: The following article attempts to analyze the emerging pattern in the Bitcoin Cash short-term market and its impact on price.
The movement of Bitcoin Cash has been heavily influenced by Bitcoin given its strong correlation as a forked asset. The strong correlation between the two has led BCH to follow BTC’s lead while sharing a correlation with the stock market. The chart below highlights the coordinated correlation between the three assets.
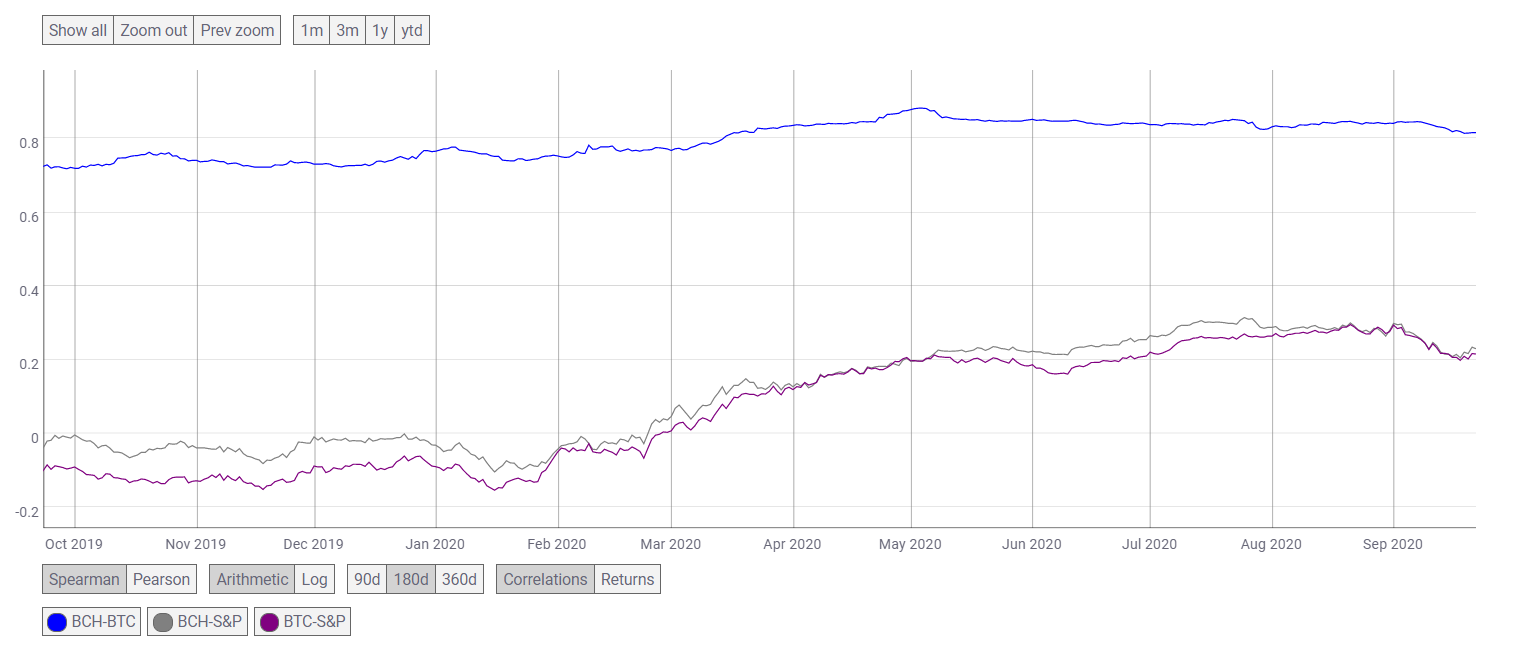
Source: CoinMetrics
The correlation between BTC-BCH may have reduced, but not lost strength. It was at 0.81692, whereas the correlation between BTC-S&P remained at 0.21582, but BCH-S&P was showing a higher association with 0.23013. Thus, the movement of BCH was not just independent of Bitcoin and even the stock market.
The recent expiry shrunk BCH’s value from $230 to $214, at press time. As the BCH price tries to make the most of the unstable market, its traders may have a tough time deciding the momentum of the price swing.
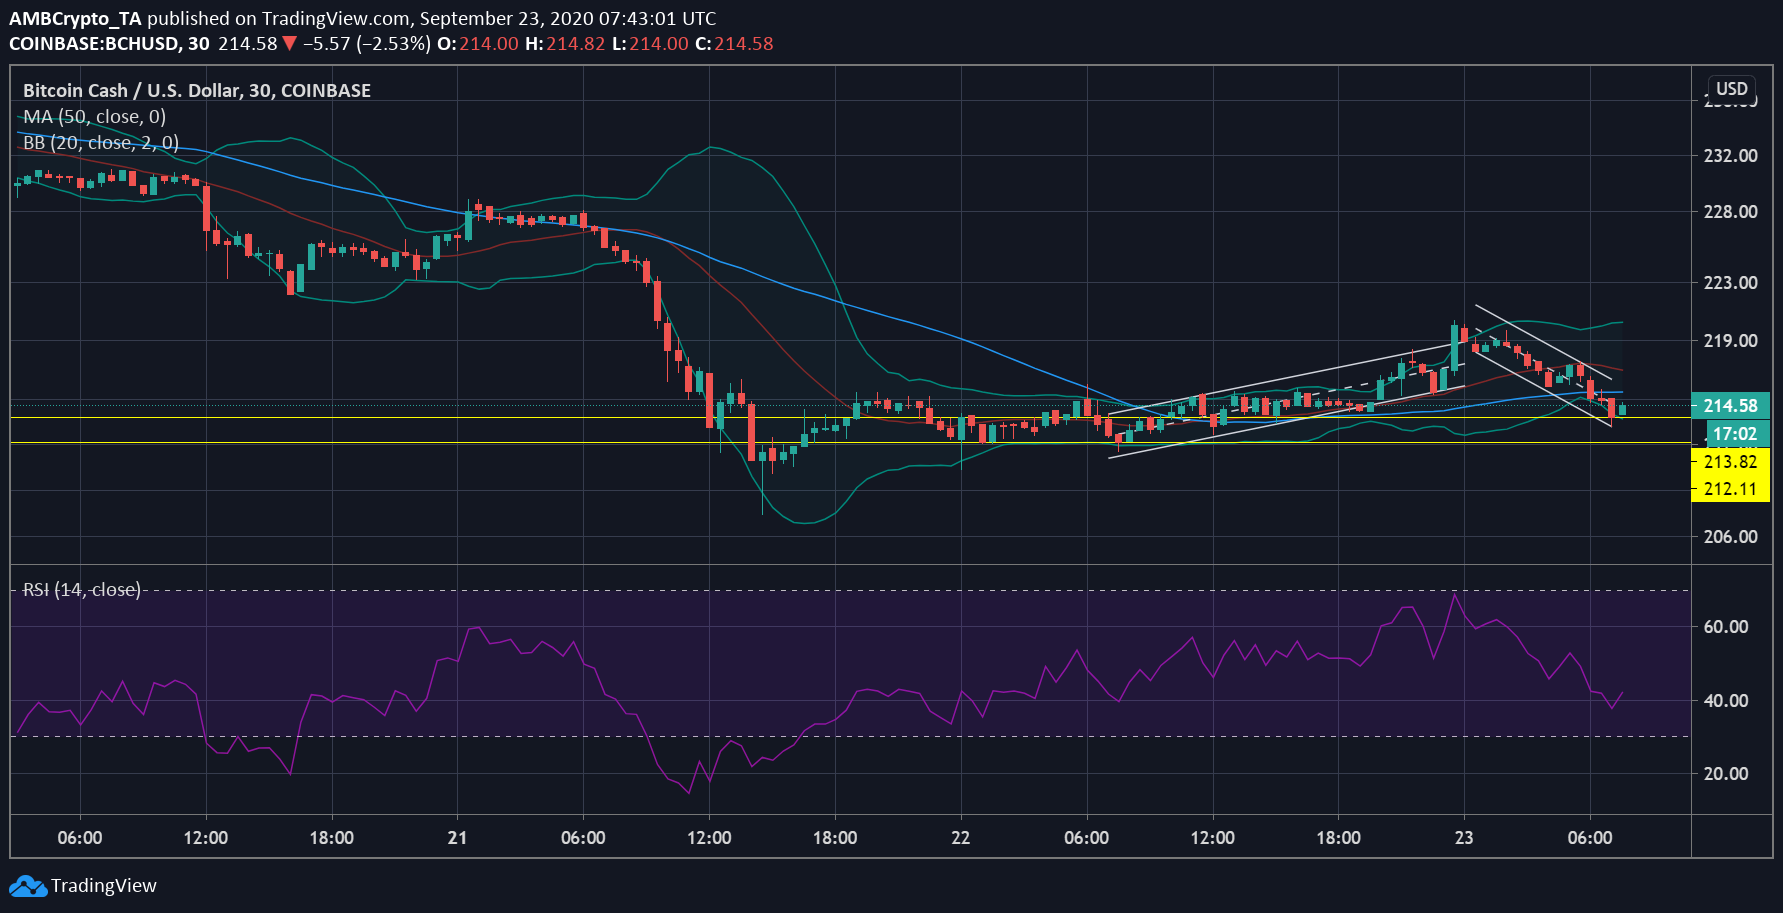
Source: BCH/USD on TradingView
The above short-term chart of BCH indicated that the price of the digital asset was close to its immediate support at $213.82. The digital asset broke out of an ascending channel pattern. However, this price hike was followed by a downward sloping price giving rise to a descending channel. The likelihood of BCH price breaking down from this pattern was high.
As the pattern painted a bearish picture, the indicators were not contradicting the present trend in the market. The Bollinger bands are opening to indicate more volatility in the market, while the signal line had taken a position above the candlesticks, suggesting the price trend was currently moving lower. The 50 moving average, however, was also above the candlesticks, noticing downwards pressure in the market. As the indicator point at a potential breakdown, the Relative Strength Index indicating a state of equilibrium for BCH.
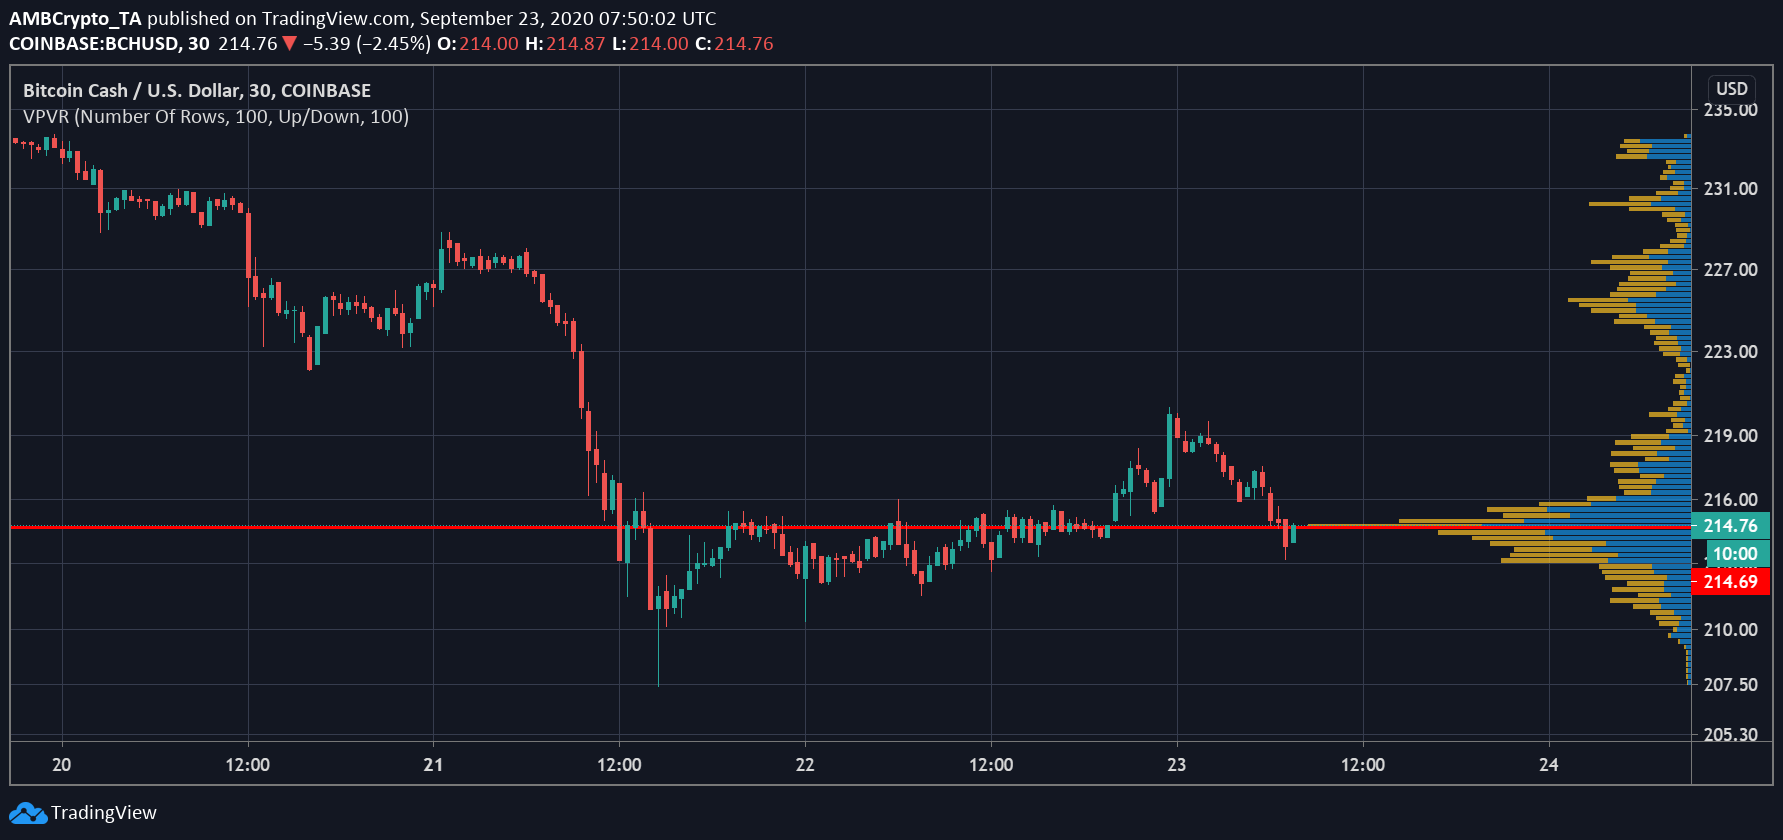
Source: BCH/USD on TradingView
As the price tried to reverse the trend, the Visible range marked the point of control for the given period at $214.69. This may act as strong support as this point has seen the highest trading volume. The price may consolidate for a while between $215.13 and $214.32, a range that has witnessed great volume for the digital asset.