
After having registered a substantial drop in value earlier this month, Bitcoin Cash has seen its price consolidate over the course of the past week. In accordance with what was expected of the altcoin market, Bitcoin’s drop below $10K had triggered a significant amount of bearish sentiment for coins like Bitcoin Cash, especially in the first week of September.
At the time of writing, Bitcoin Cash was being traded at $223 with a market cap of $4.1 billion. Over the course of the past 24-hours, BCH was observed to have noted a minor uptick of 0.7 percent, after having registered a trading volume of $2 billion.
Bitcoin Cash 1-hour chart
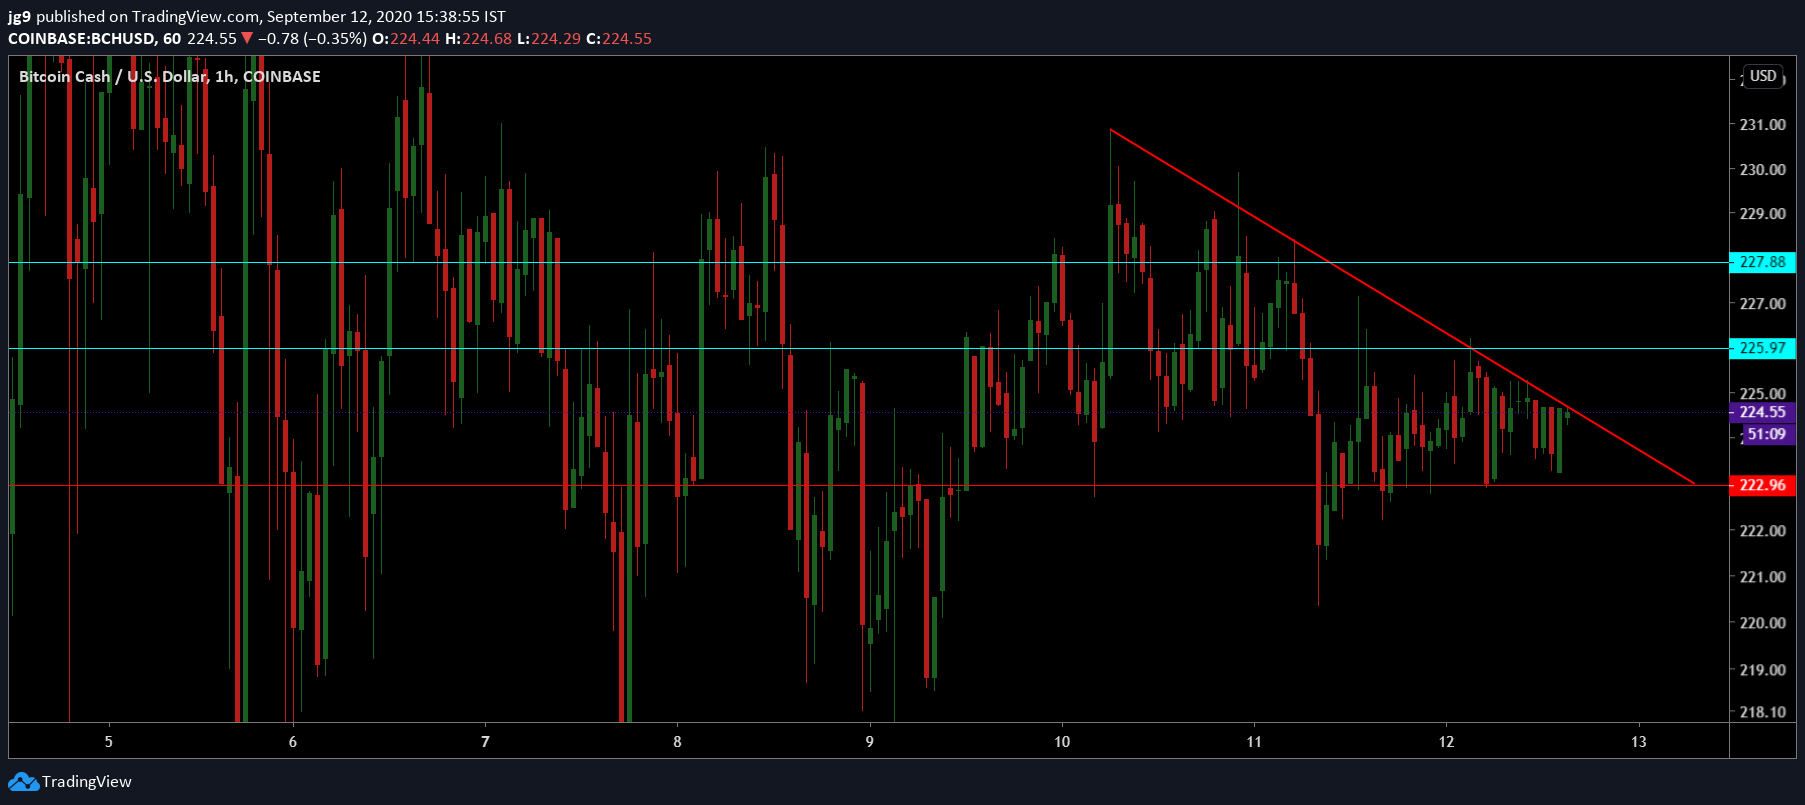
Source: BCH/USD, TradingView
According to the hourly chart for Bitcoin Cash, since 10 September, the cryptocurrency’s price action has been part of a descending triangle formation and in the coming day’s time, the price action is unlikely to break out of it. The press time trading price of BCH was very close to testing the support at $222, a level which is also the price target for the coin in the short-term.
However, if BCH were to note increasing bullish sentiment in the coming days, then the cryptocurrency may head towards its immediate resistance level [$225 – $227], a range that has been quite hard to breach over the past few days.
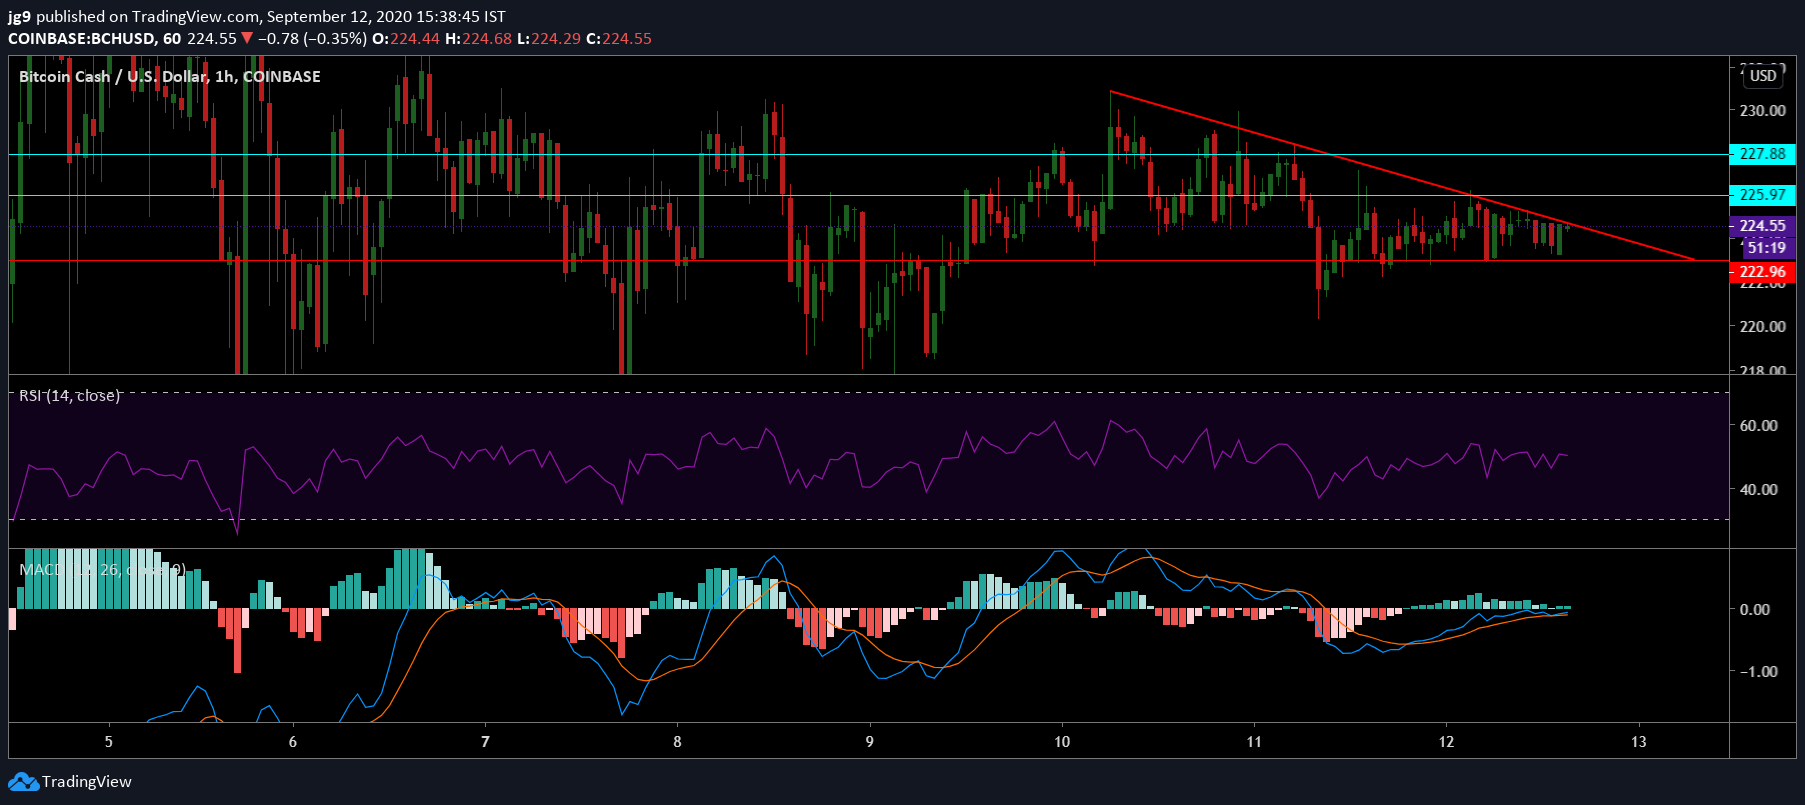
Source: BCH/USD, TradingView
Taking into account the indicators for BCH, it can be argued that the cryptocurrency is going to remain within the formation over the course of the next 24 hours. The MACD indicator was on the verge of bearish crossover, at press time, with the Signal line inching closer to the MACD line that was currently above it. The RSI, on the other hand, seemed to be moving away from the neutral zone and back into the oversold zone.
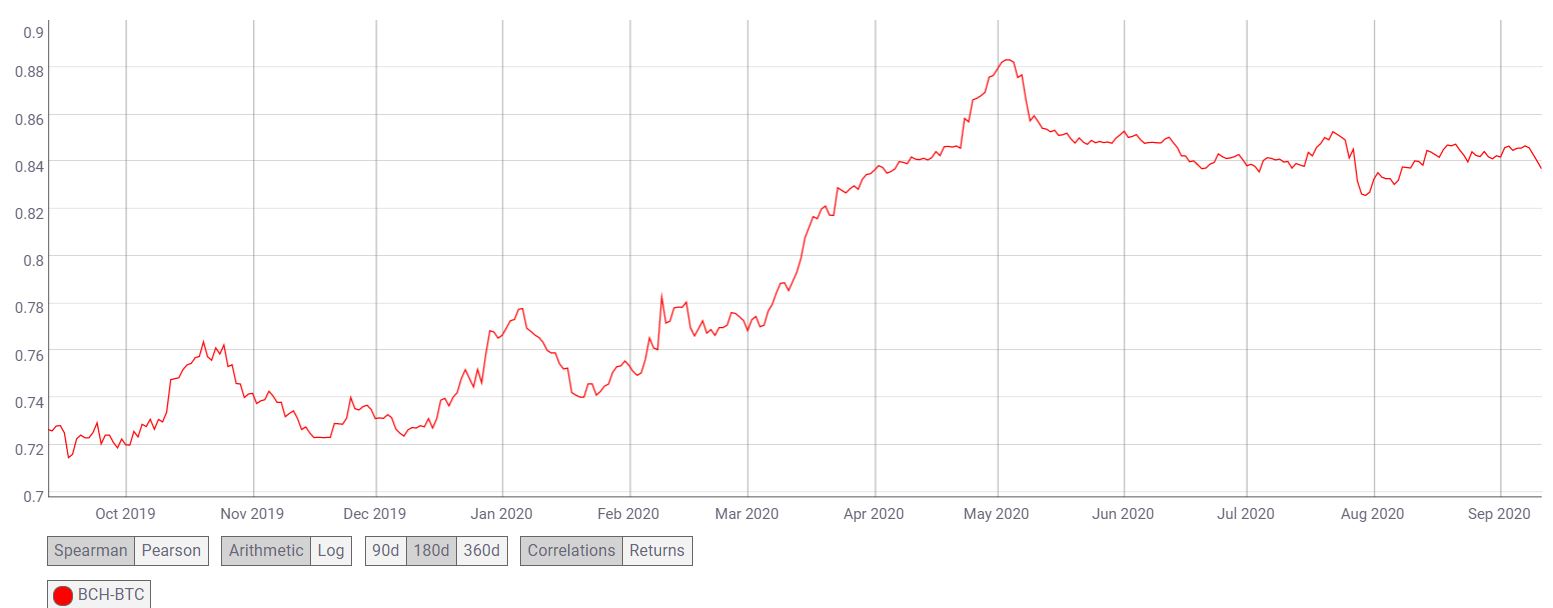
Source: CoinMetrics
Like many of the market’s altcoins, the correlation with Bitcoin has been fairly strong for BCH and the past week’s price action is evidence of that fact. Over the past year, the BCH-BTC correlation rose from 0.72 to 0.84, making BCH extremely susceptible to the swings in Bitcoin’s price market.
Conclusion
After having spent a few days in the descending triangle formation, BCH looked rife for a breakout. However, in the next 24-hours’ time, the cryptocurrency is likely to stay within the formation and head towards the support at $222. However, if BCH is overcome by strong bullish sentiment, a price breakout targeting the resistance at $225 is quite likely.