
Disclaimer: The findings of the following analysis attempt to foresee Bitcoin Cash’s price movements until the second week of August
Bitcoin Cash’s price has continued to find it very difficult to go past its 12 March price levels. Over the course of the past few months, BCH’s price has continued to bounce between $215 and $269, sometimes quite often. While the coin’s performance seemed very promising at the start of 2020, its second-quarter performance has been a far cry from it.
At press time, Bitcoin Cash was being traded at $241, with the cryptocurrency occupying the fifth spot on CoinMarketCap’s charts with a market cap of $4.4 billion. Over the past 24 hours, BCH’s price had registered a price hike of 2.8 percent and was noting a 24-hour trading volume of $1.3 billion.
1-day Chart
Source: BCH/USD, TradingView
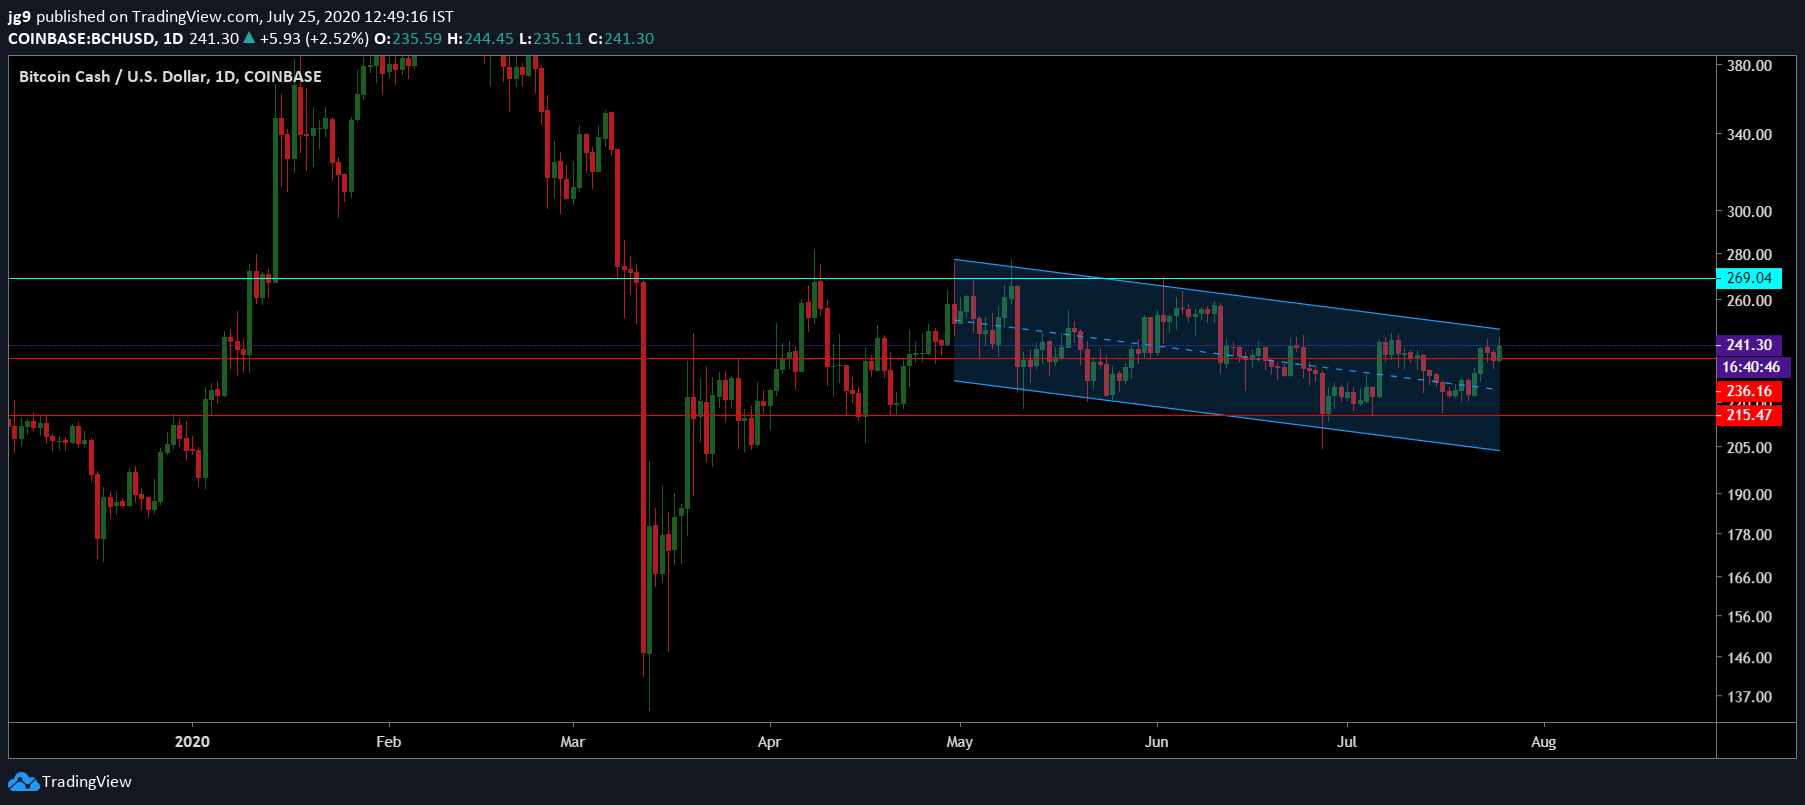
According to the daily time frame on BCH’s chart, the price of the fork-coin has been in a descending channel formation since the start of May. However, BCH may be on the verge of a breakout from the formation. In such cases, given the formation it is in, it is not out of the question to assume that there is a higher chance of an upward breakout for BCH and it may find itself heading towards the strong resistance that BCH’s price has tested on multiple occasions.
At press time, BCH’s price was testing the support at $236 and if the support were to hold strong, the coin’s chances to head toward the immediate resistance at $269 may not be foiled. Given the previous price action of Bitcoin Cash, it is safe to assume that the price is likely to head towards Target 1 – the resistance at $269 within the second week of August. However, if the support were to fail, the price may see a correction and drop down to $215.
Source: BCH/USD, TradingView
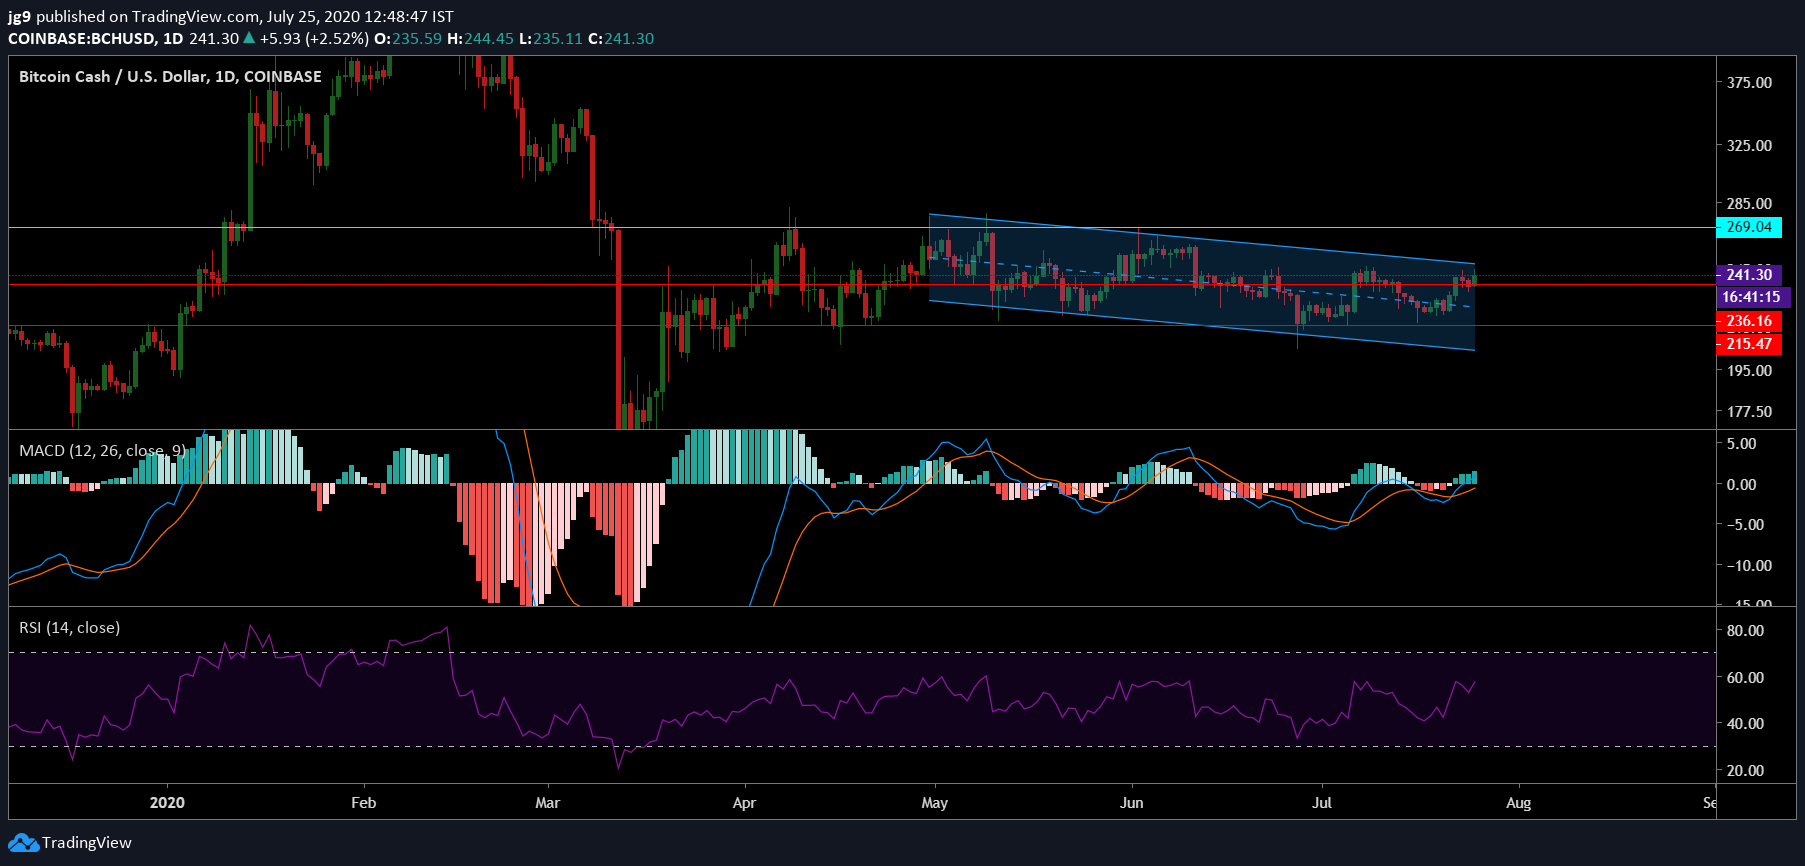
When Bitcoin Cash’s 1-day chart is observed, it can be seen that BCH’s technical indicators are signaling strong bullish sentiment for the coin’s price. In fact, the MACD indicator had recently undergone a bullish crossover, with the MACD line going past the signal line. The Relative Strength Indicator mirrored the same sentiment and at the time of writing was closer to the overbought zone – positioned around the 60-mark.
Source: CoinMetrics
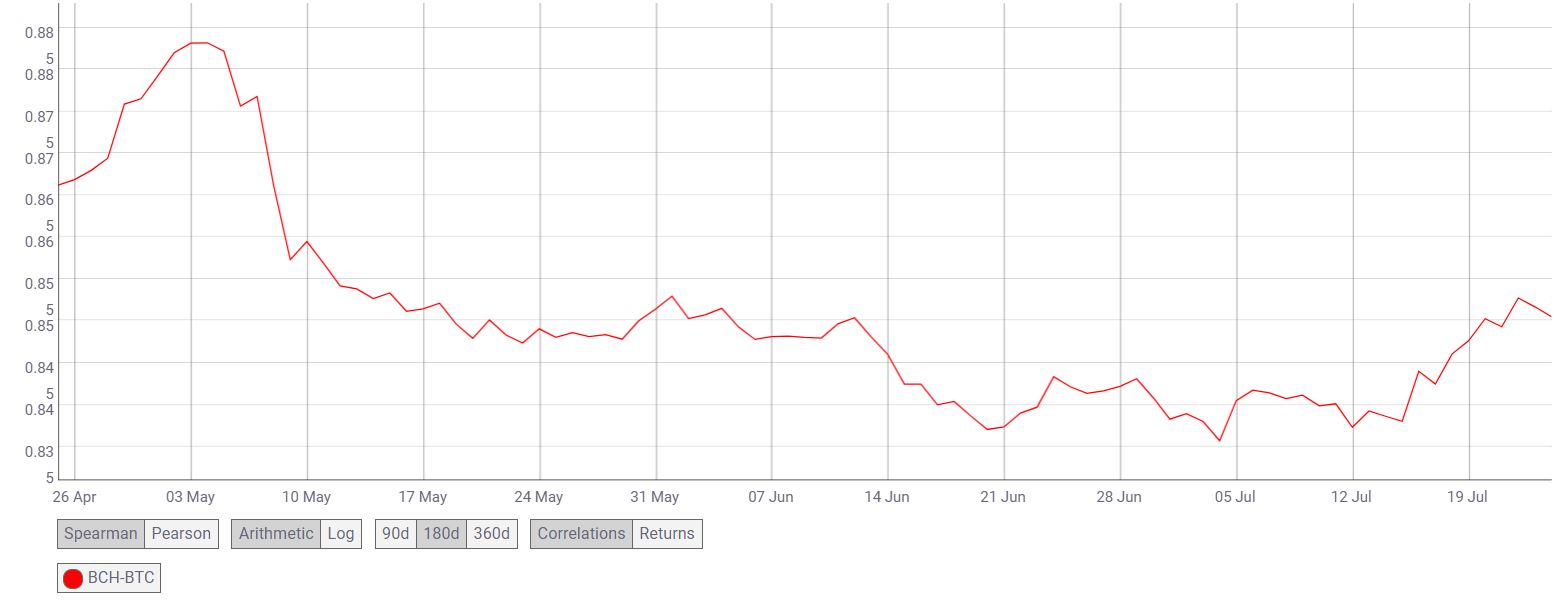
While traditionally altcoins have seen a high correlation with Bitcoin, the past few months have strayed from the norm. Over the same time frame, BCH has seen its correlation with Bitcoin drop substantially from 0.883 to a low of 0.838, signaling the possibility of an independent bull run for BCH.
Conclusion
Bitcoin Cash has been in a descending channel formation for close to three months and the price breakout is likely to happen soon. Taking into account the indicators and the probable price breakout, a minor surge is quite possible for BCH as it is likely to head towards its resistance at $269, which is the primary target for the coin’s price.
However, if the bears were to overpower the coin, a dip towards its second support at $215 cannot be overlooked.