
Disclaimer: The findings of the following article are the sole opinion of the writer and should not be taken as investment advice
Bitcoin Cash’s price has been on the rise since the start of September, with its charts highlighting the strong bullish momentum in its market. However, the cryptocurrency’s good fortunes may be coming to an end as November progresses as for the most part, BCH’s price action this month has been fairly sideways. However, with the coin likely to break out of its price formation, is a price correction likely for the market’s 6th-largest cryptocurrency?
At press time, Bitcoin Cash was being traded at $260, with the crypto having registered a market cap of $4.8 billion and a 24-hour trading volume of $2.3 billion. Over the course of the past week, the coin had depreciated by over 4 percent.
Bitcoin Cash 1-day chart
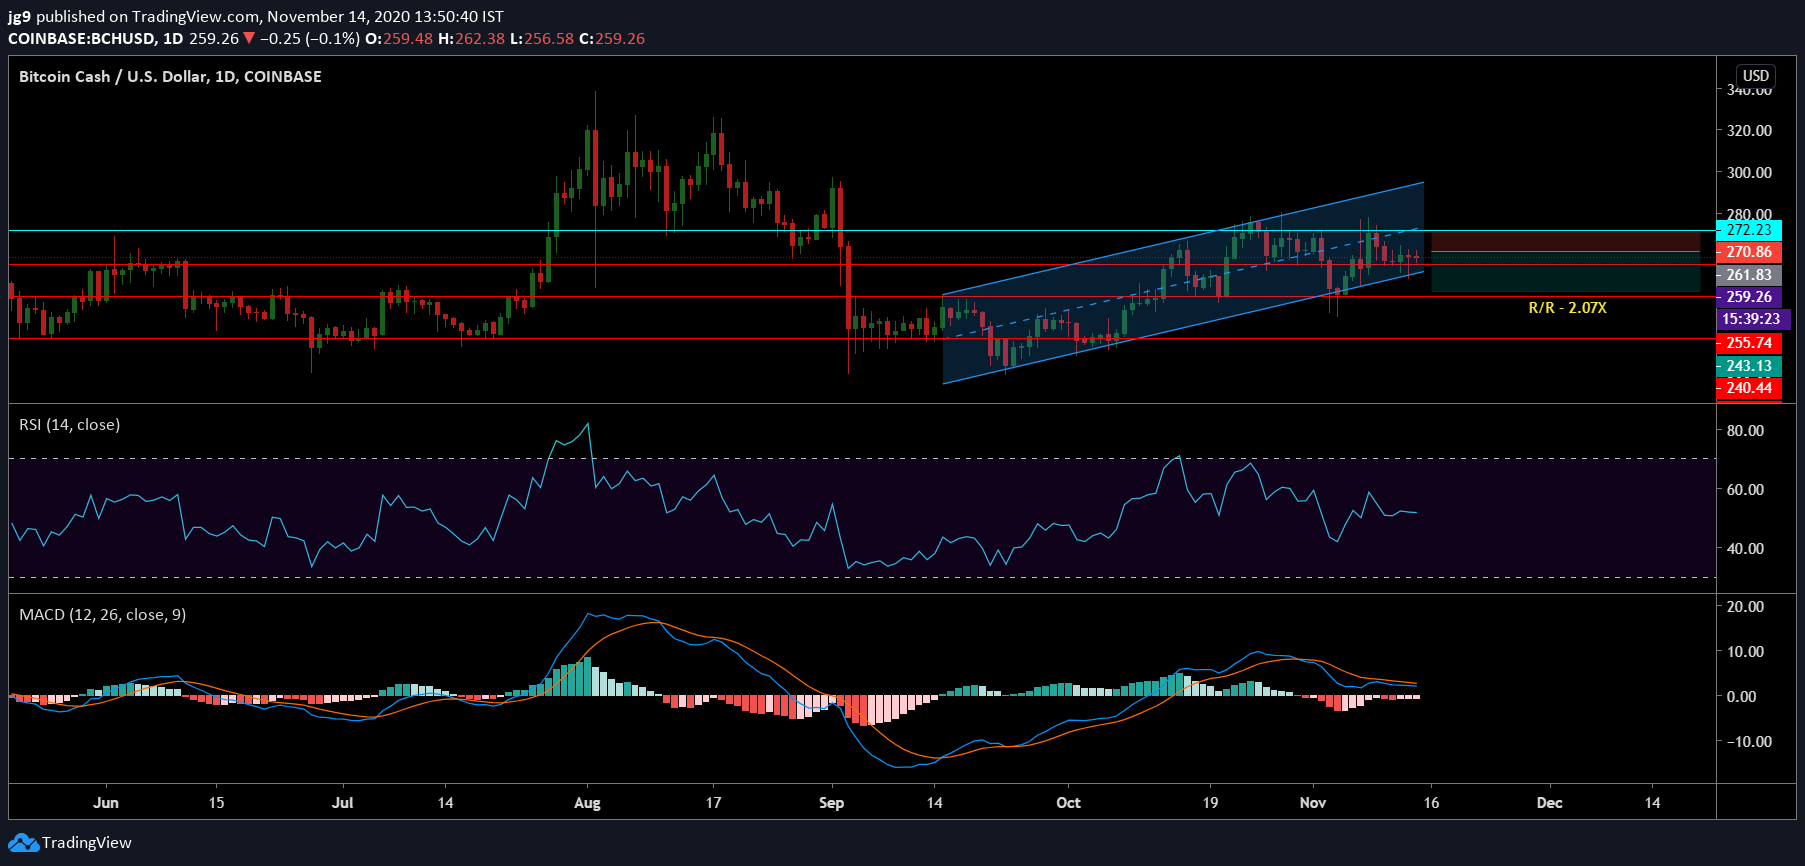
Source: BCH/USD on TradingView
According to the daily chart for Bitcoin Cash, BCH’s price has been confined between the support at $220 and the resistance at $270 over the past few months. After having formed an ascending channel formation, if a breakout does happen in the coming week, it is likely to force a price correction for BCH. In such a scenario, if the press time support fails, BCH’s price may head towards the next support at $240.
Earlier in the week, the crypto did face strong resistance at the $272-price level. Taking into consideration the fact that the RSI is slowly heading into the oversold zone, there may not be enough bullish momentum to fuel another attempt to breach this key point of resistance for BCH.
Reasoning
This possibility is supported by BCH’s technical indicators as the bullish sentiment for the coin seemed to be fading away. The MACD indicator for the coin underwent a bearish crossover with its Signal line going past the MACD line. This is normally a bearish sign and signals the high probability of an upcoming price drop. The RSI echoed a similar view as it was pointing towards the oversold zone.
Important levels
Resistance: $272.2
Support: $255.7, $240.4, $220.7
Entry: $261.8
Take Profit: $243.1
Stop Loss: $270.8
Conclusion
After having remained in an ascending channel formation for close to three months, BCH may be on the verge of a bearish breakout. This is supported by the indicators and may see BCH’s price fall by over 8 percent, taking its trading price to the support at $240 over the upcoming week.