
BAT lacked a significant trend in the short-term as it retraced to important levels after a recent surge. EOS could be flipping from bearish to bullish momentum. Litecoin continued to show bearishness.
Basic Attention Token [BAT]
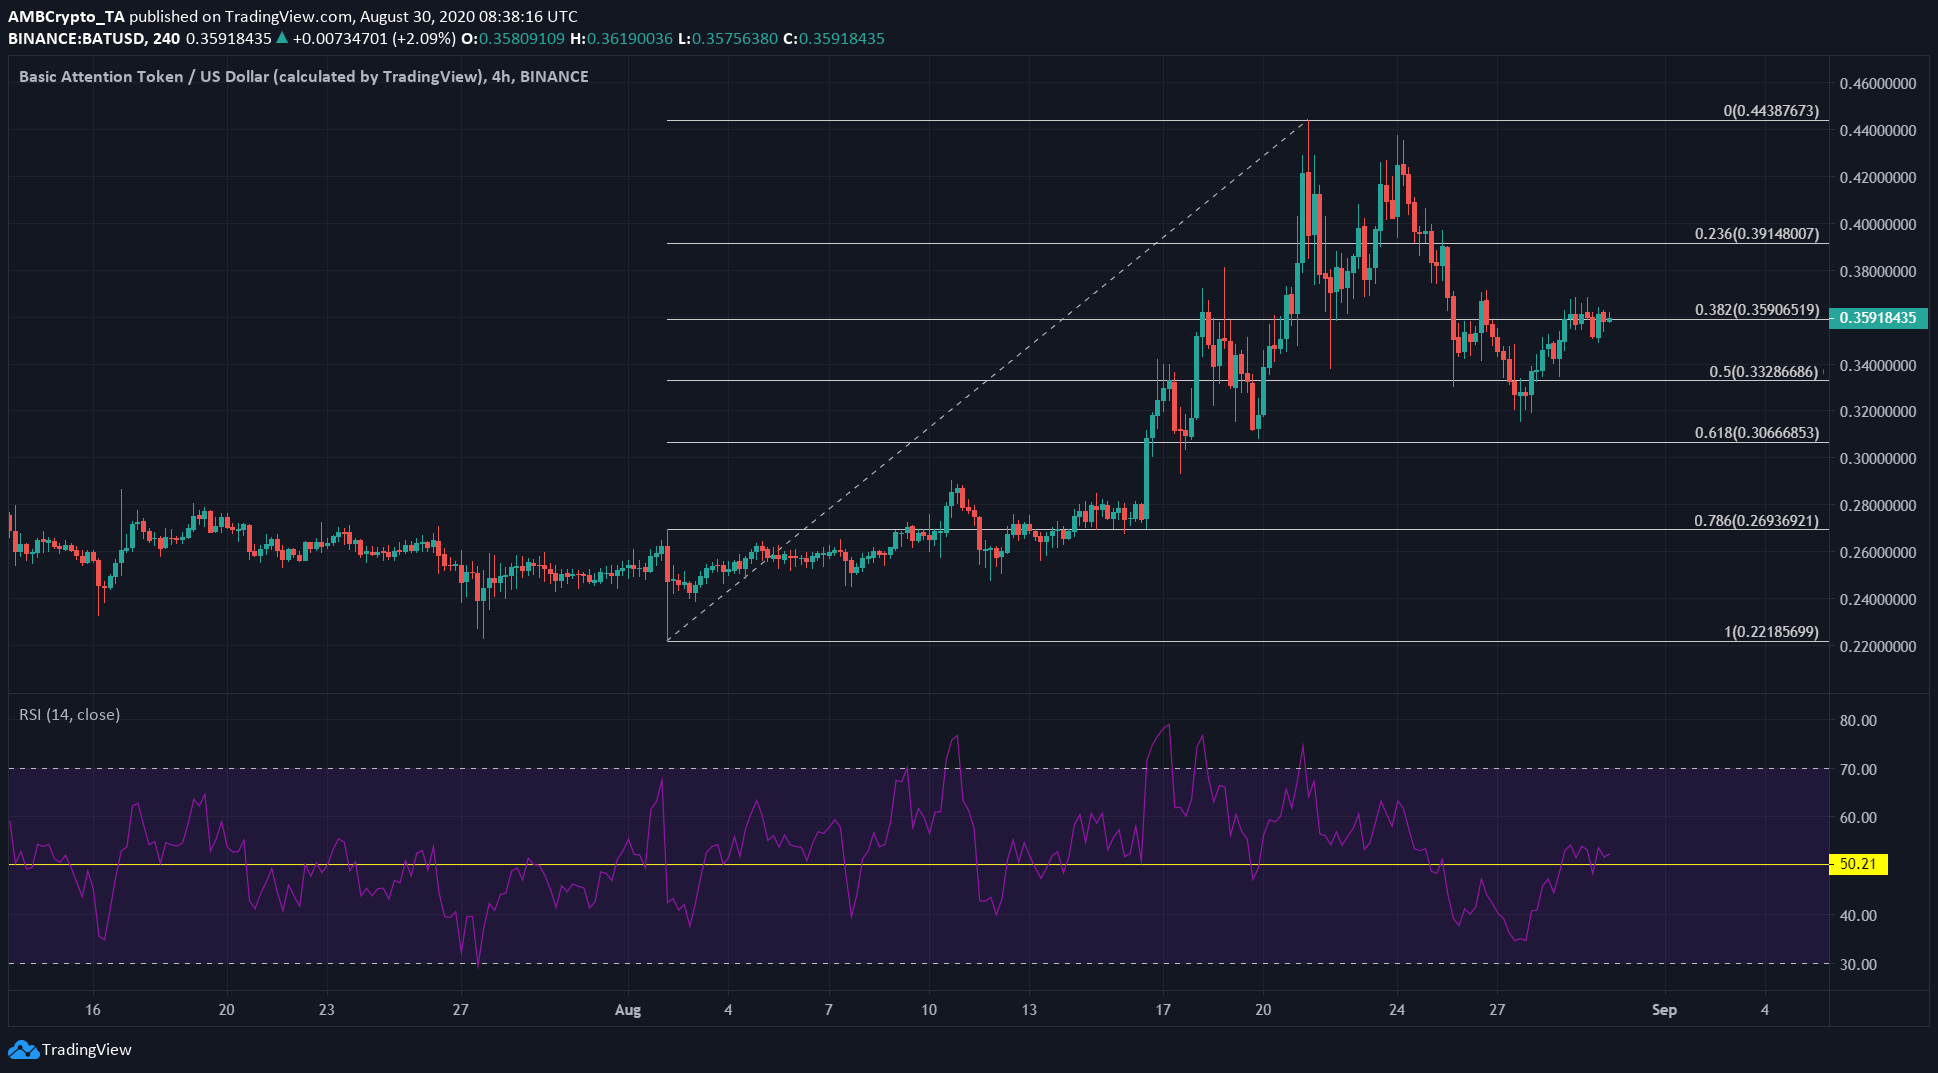
Source: BAT/USD on TradingView
BAT was trading at the 38.2% retracement level, after its spike to $0.443. It briefly dipped to find support at the 50% retracement level, $0.332.
At the time of writing, RSI stood at 52. No trend was suggested by the indicator in the short term. We can expect this recent move of BAT to be a pullback and for the uptrend to continue.
EOS
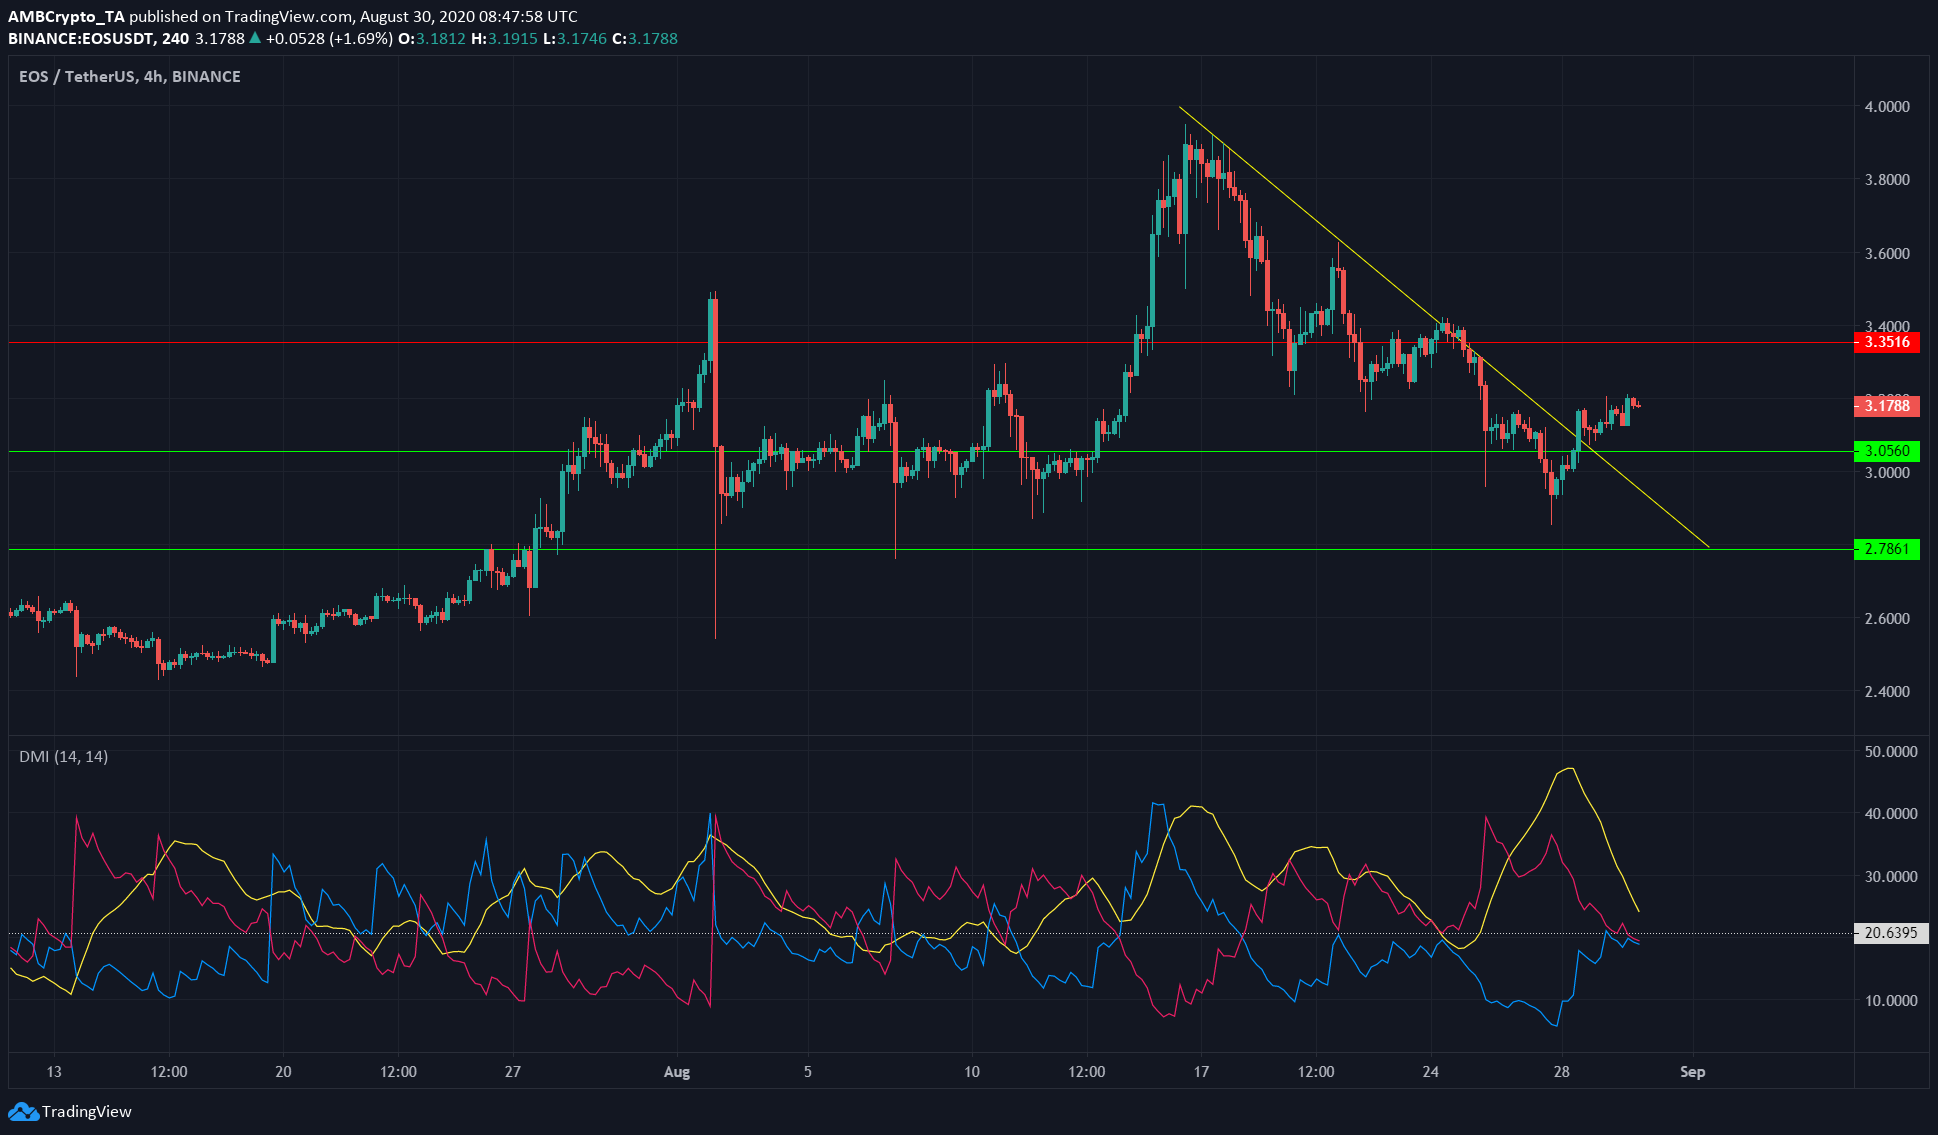
Source: EOS/USDT on TradingView
EOS broke past the downtrend (yellow) it faced the past couple weeks and was trading above support at $3.05. It had a 24h trading volume of $1.6 billion on 29 August, significantly less than $2.5 billion on 25 August, when the coin dropped from $3.32 to $3.12.
The lack of significant volume is, by itself, significant. It indicated that traders were waiting for the market to make a definitive move, before initiating any trades.
Directional Movement Index (DMI) had been strongly bearish, but it could be changing to a bullish trend in the coming sessions, as ADX (yellow) dropped towards 20, while -DMI (pink) and +DMI (blue) could cross each other if the market grows more bullish.
Litecoin [LTC]
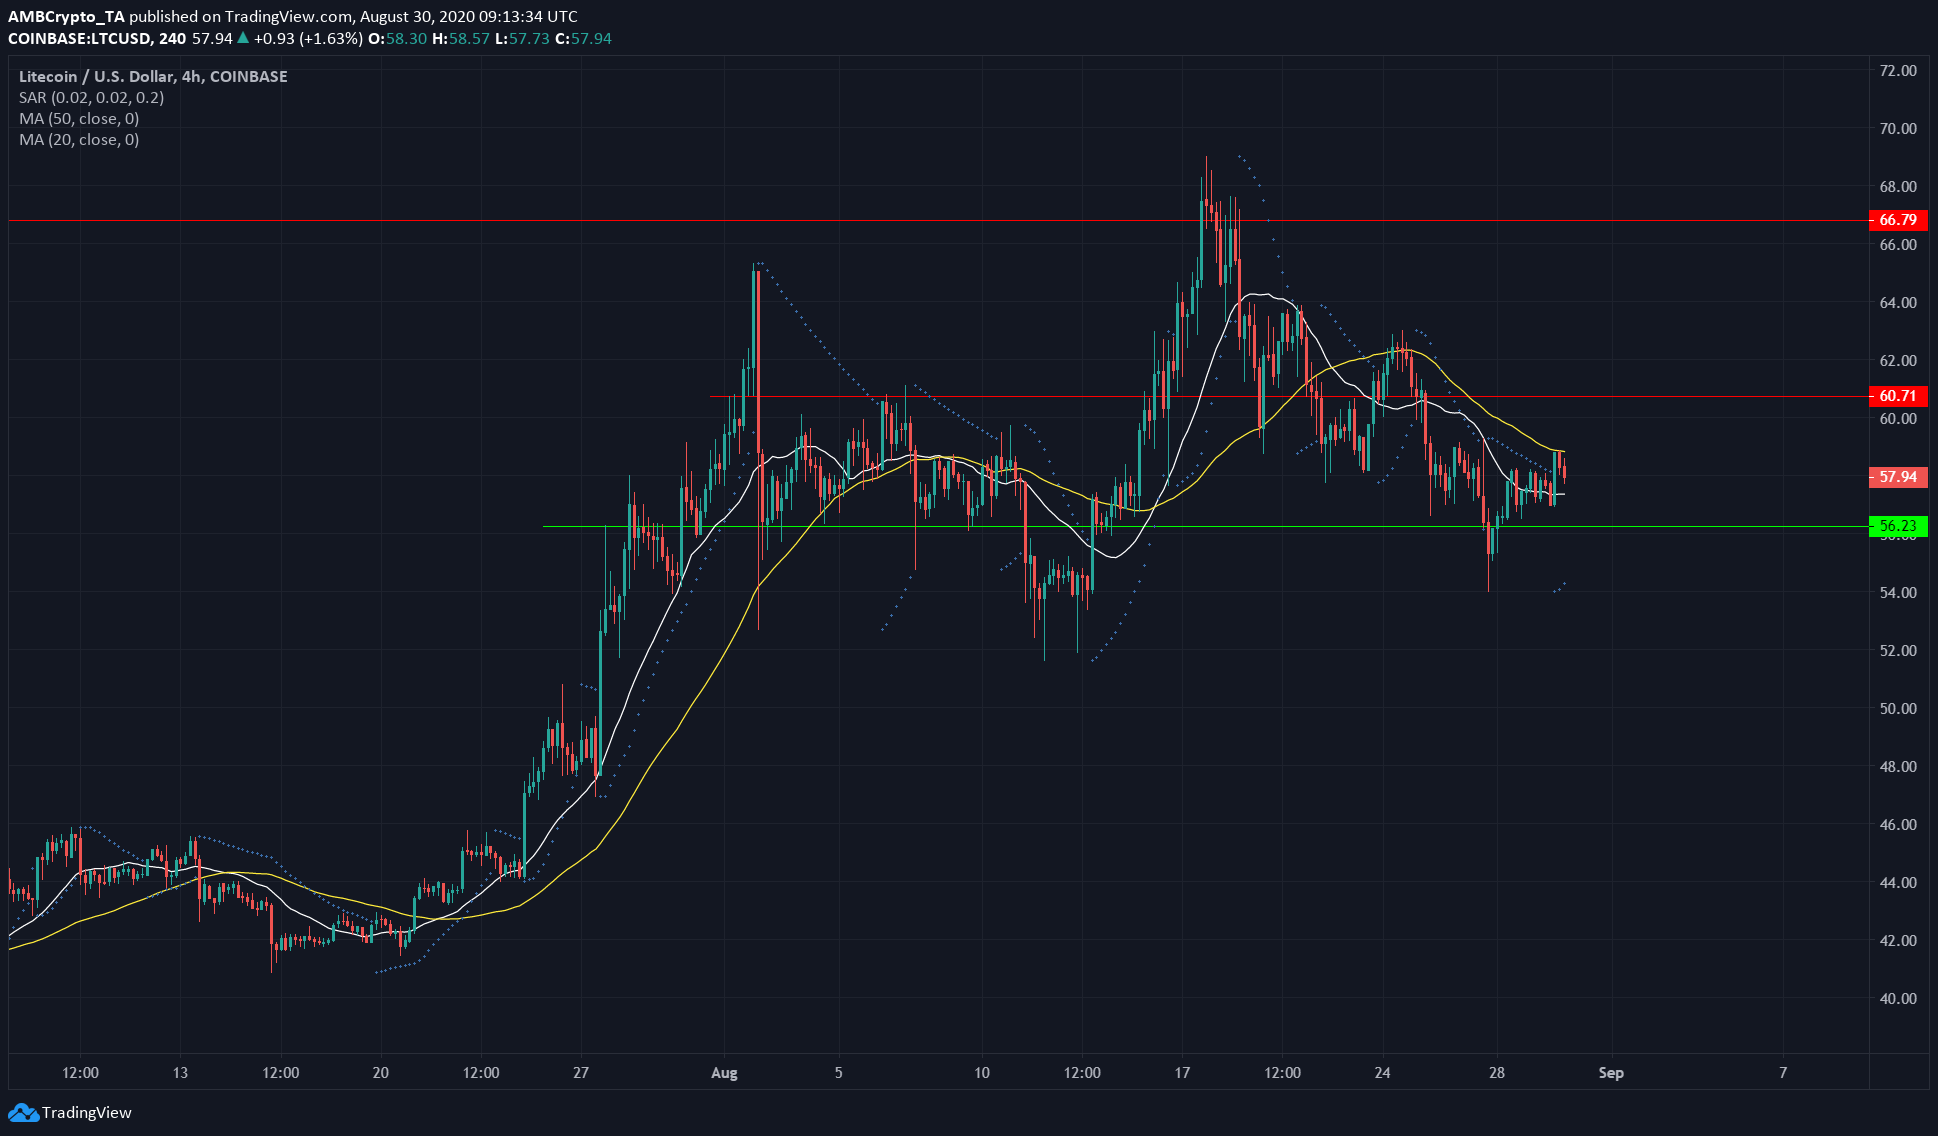
Source: LTC/USD on TradingView
Litecoin held spot 7 on CoinMarketCap, with a marketcap of $3.8 billion. Referred to as the silver to Bitcoin’s digital gold, it followed Bitcoin in the market, and fell from $66 to $55 alongside Bitcoin, as BTC fell from $12,500 to $11,200.
$57.6 had previously been a Point of Control, and was trading at $57.93 at press time. There was bearish pressure on the coin.
In the short-term, 20 SMA (white) stayed below 50 SMA (yellow), showing bearishness. Parabolic SAR switched from a sell to a buy signal, but that was only due to one session where the price rose from $57 to $59.
Important levels to watch are the moving averages which will act as resistance and support stood at $56.
![Reasons why Litecoin [LTC] investors should be concerned](https://eng.ambcrypto.com/wp-content/uploads/2023/12/ambcrypto_A_Litecoin-themed_scen-400x240.png)