Bitcoin’s highest monthly close since 17-18 – What to expect this November

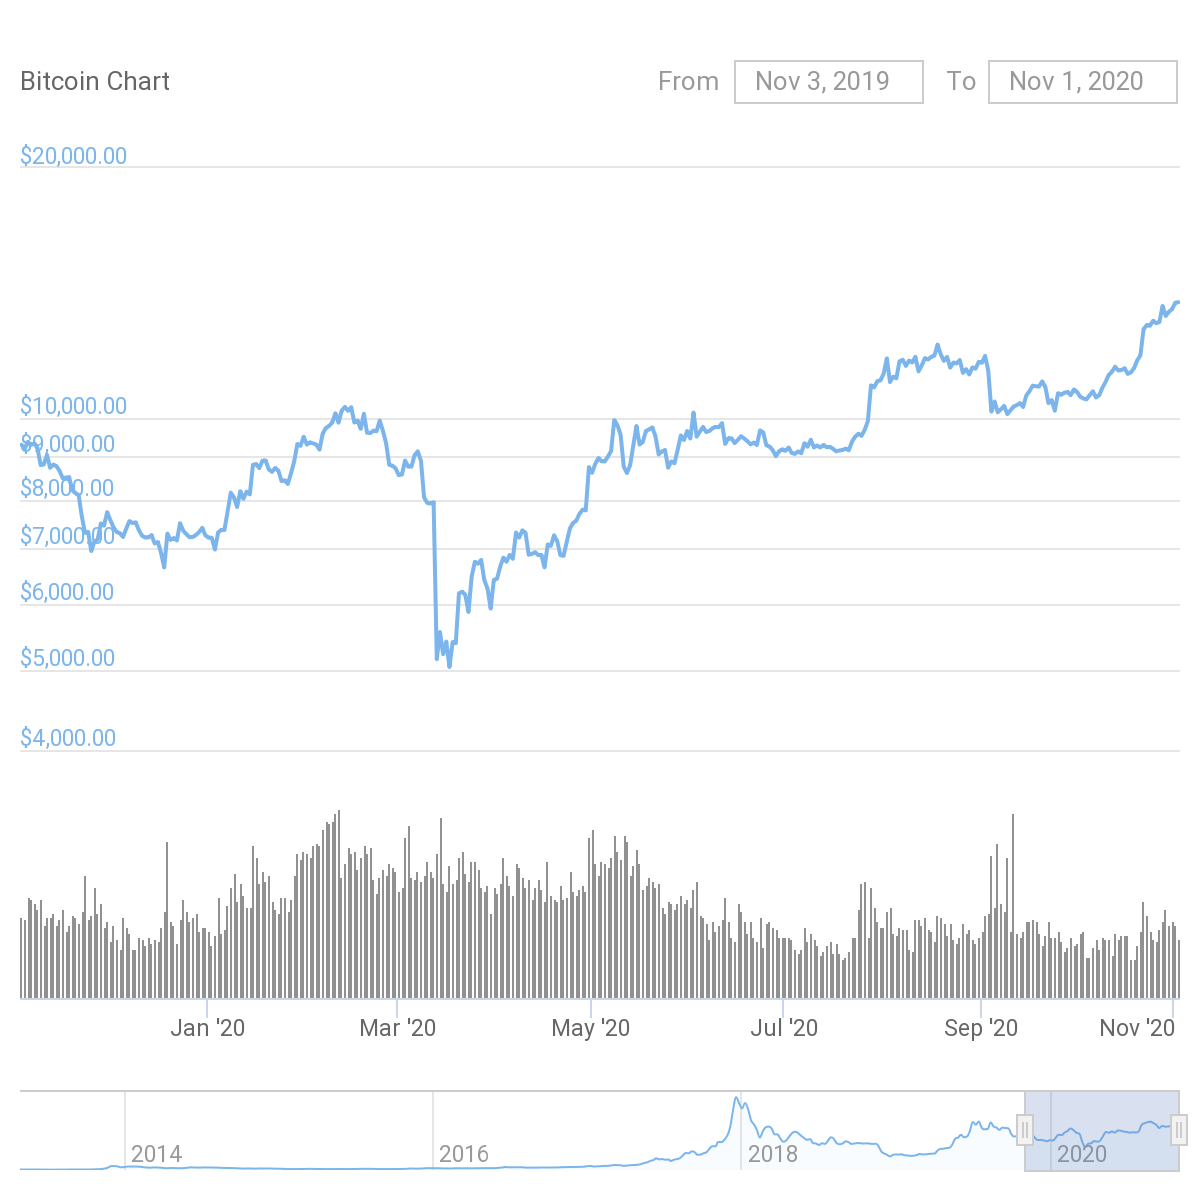
A few days ago, Bitcoin ended the month of October by closing above $13,700. This was big news since this was the highest monthly close since the historic bull run back in 2017-18. A high close at a time when Bitcoin is not massively leveraged and when exchange reserves are still low points to the maturity and health of the network. In fact, what’s more interesting is the fact that despite none of the mass euphoria of 2017, the price has sustained itself above $10,000 for over 3 months now.

Bitcoin Price Chart || Source: CoinGecko
At the time of writing, however, Bitcoin had fallen on the charts. While BTC was still trading above $13400, its fall did point to two things – 1) The cryptocurrency is struggling against its resistance and, 2) Bitcoin is clearly overbought.
While Bitcoin’s fair price remains $8,500, BTC is climbing towards the $14,000-level. Further, what is also interesting is that trade volume on exchanges and the Open Interest on derivatives exchanges is average, or below the 90-day average. The tulip-like boom and bust of 2017 had an impact on the cryptocurrency market and so did the third halving.
However, the post-halving gain of nearly 51% points to a sustainable recovery in Bitcoin’s value. Bitcoin’s monthly close was critical to this recovery as it came five months past the halving and exchange reserves are low. And while 97% of HODLers are profitable, the cryptocurrency sustaining itself at the current price level is more crucial for November 2020, than hitting a new high or a previous ATH.
Consider this – The monthly close over the past four months, before October 2020, was as follows,
– In September 2020, Bitcoin closed at $10,700
– In August 2020, Bitcoin closed at $11,600
– In July 2020, Bitcoin closed at $11,300
– In June 2020, Bitcoin closed at $9,100
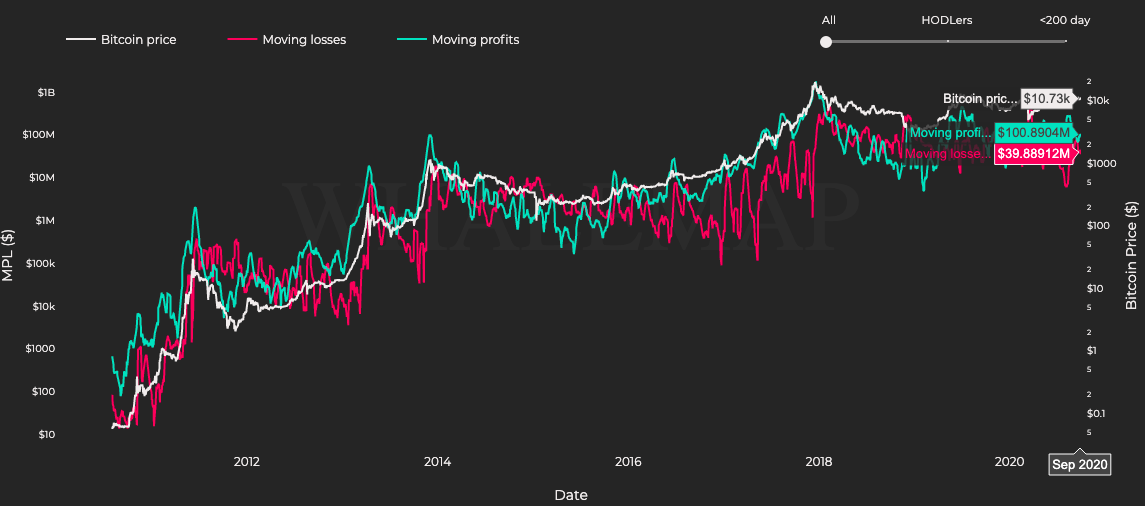
With the exception of September 2020, every month Bitcoin‘s close was higher than the previous month’s and the price rise was sustained with few anticipated corrections. October’s high close points to further bullish price action in November 2020. Such bullish action is evident when WhaleMap’s MPL chart is observed. Over the past month, for instance, $39M in losses were recorded against $100M in profits and more traders/HODLers are now choosing to wait for exiting trades with profits.

Moving Profits and Losses || Source: Whalemaps
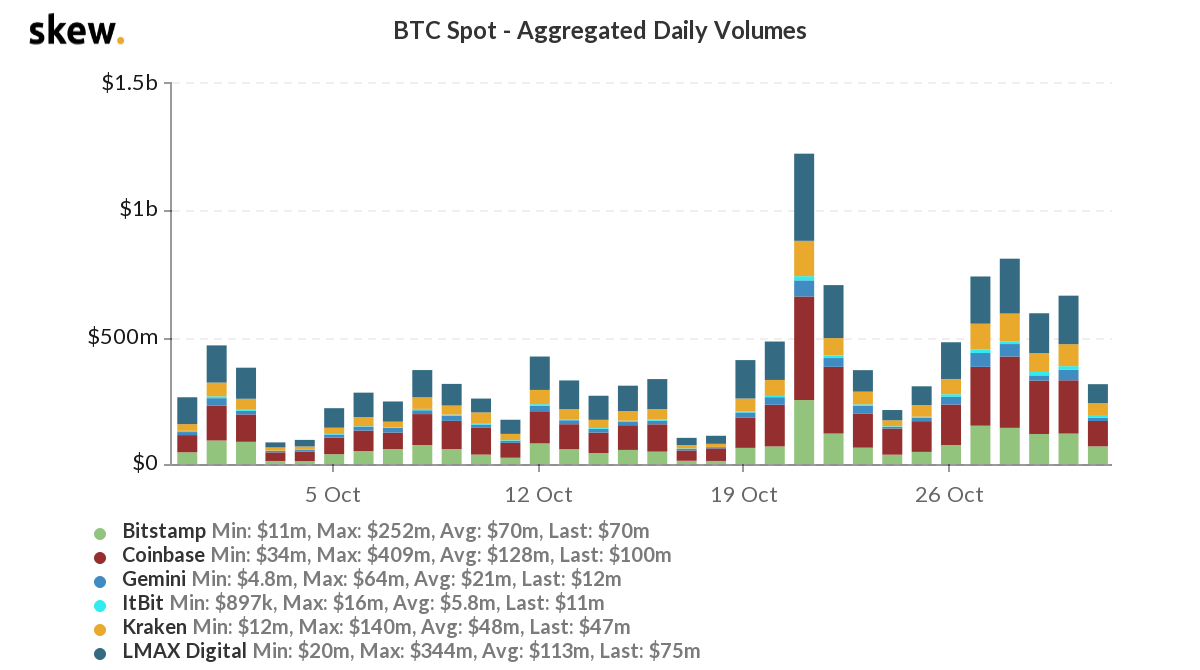
Besides moving profits and losses, the trade volume on spot exchanges is a measure of the demand in the market. New demand is being generated at a slow pace, however, the trade volume was nearly the same as the 60-day average over the past month. Trade volume hit $1.2B only once over the entire month, remaining largely below $500M on other days.

BTC trade volume on spot exchanges || Source: Skew
While a high monthly close gave Bitcoin’s price a bullish start to November, its 24-hour price drop of nearly 2% hints at the possibility of a correction. If the trade volume is not sustained on spot exchanges, a correction wave may be the norm before any other resistance levels are tested this month.


