Ethereum’s falling wedge pattern formation could lead coin to $275

Despite a brief rally to $196 against the US Dollar last week, Ethereum retreated soon after and currently changed hands at $184.78, according to data from CoinMarketCap, with a market cap of 19.97 billion, at the time of writing. October has not been bullish for the coin and positive patterns are yet to gain prominence on the ETH charts.
Ethereum Daily Chart:

Source: ETH/USD on TradingView
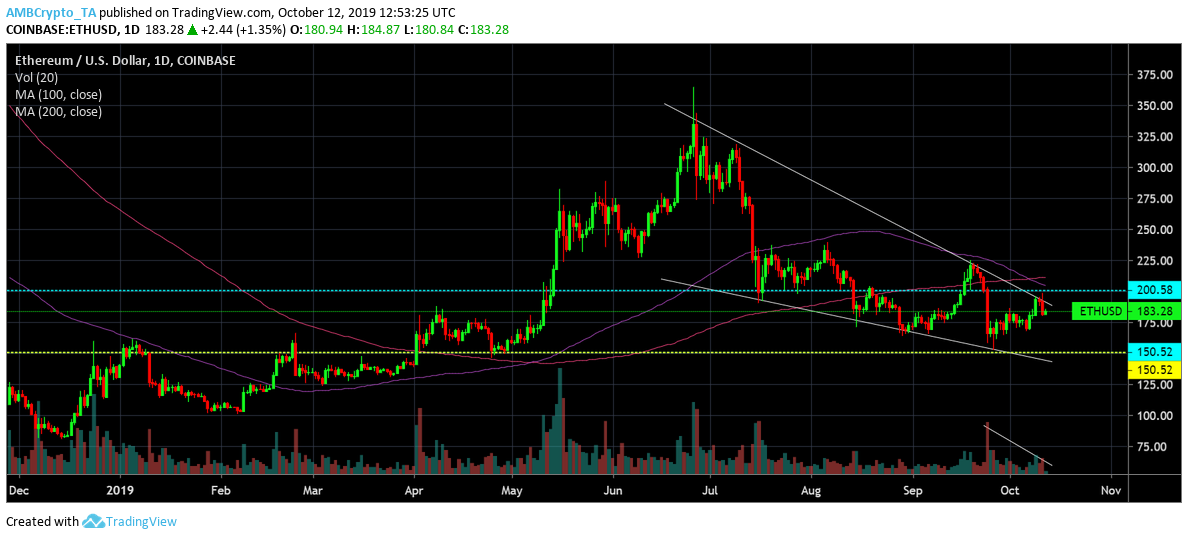
The one-day ETH chart depicted the formation of a falling wedge pattern with the price following two down-sloping and converging trendlines. This pattern was indicative of a possible bullish breakout in the near-term. The declining volume further provided validity to the pattern.
100 moving average was, however, below 200 moving average and suggested a bearish picture.
The first half of the year saw the price below moving averages and after a respite of nearly four months, the price dived below the moving averages for the second time this year. 100 and 200 moving averages recently suffered a bearish crossover and no sign of trend reversal was seen.
Ethereum’s price found a major push from $200-level. A breach in this psychological resistance level following the closure of the falling wedge pattern could swing the coin’s value higher to another point at $204.6 just below major resistance at $275. ETH bulls found support at $150.52.
Positive sentiment on the long-term chart

Source: ETH/USD on TradingView
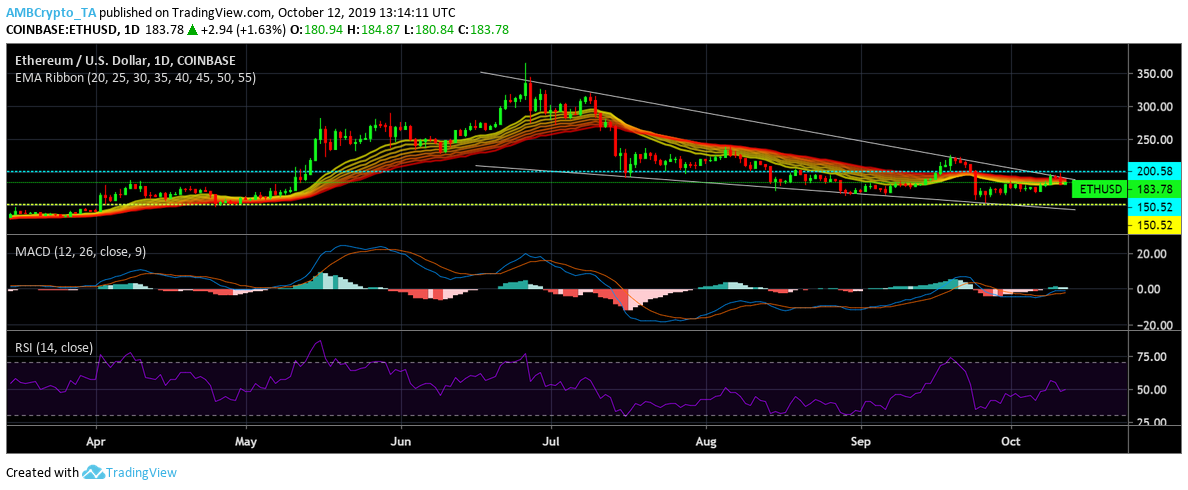
MACD indicator remained bullish for the coin’s future. The EMA Ribbon hinted at a possible convergence and projected signs of volatility for ETH’s price. As EMA Ribbon remained above the candles, it acted as a resistance. Additionally, RSI touched 50-median and hence, indicated a stable market with neither high buying nor selling pressure.
Conclusion
The indicators and the falling wedge pattern formation signaled for a positive price breakout despite RSI’s inaction and moving averages aligning with the bears. The chances of price hitting $275 seem more than likely as the breakout occurs.


